
Figure 3. The Impact of Bacteria on Viral Co-infection.
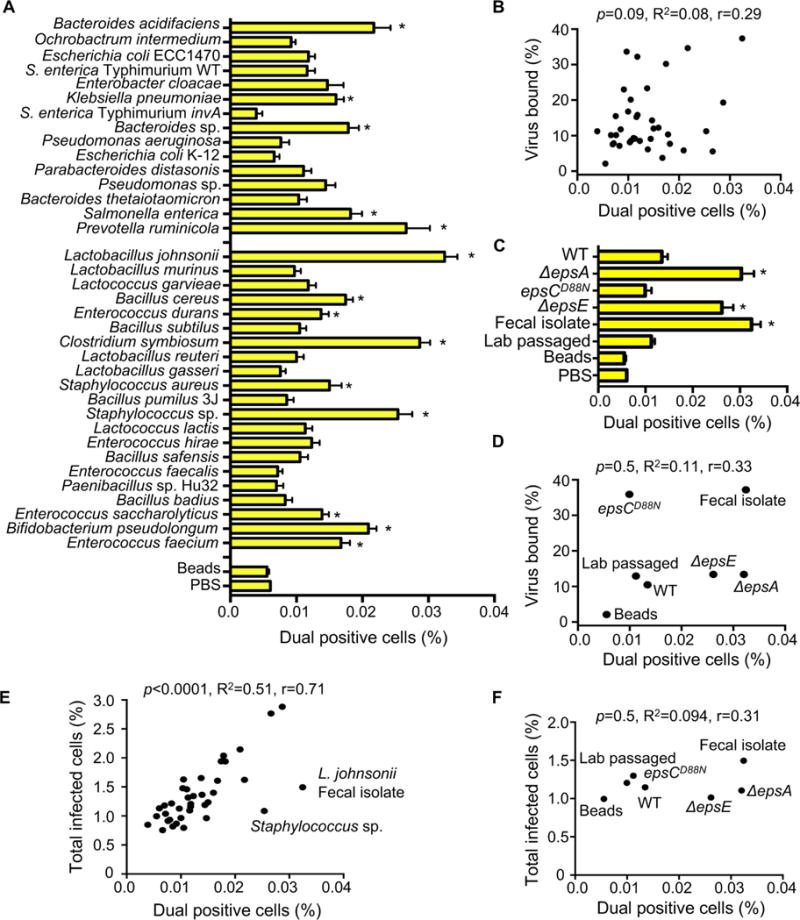
(A) Percentage of dual infected cells positive for both DsRed and GFP determined using the flow cytometry assay described in Figure 2. Data are represented as mean ± SEM (n=8–52, ≥3 independent experiments). *p<0.05 versus Beads (one-way ANOVA followed by Dunnet’s multiple comparison test). (B) Scatter plot to test for correlation between the percentage of dual infected cells and the percentage of virus bound for each bacterial strain. Data points are the mean values presented in Figures 3A and 1E. p=0.1, R2=0.08, r=0.3 (Pearson’s correlation coefficient calculation). (C) Percentage of dual infected cells for L. johnsonii strains. Data are represented as mean ± SEM (n≥6). *p<0.05 versus Beads (one-way ANOVA followed by Dunnet’s multiple comparison test). (D) Scatter plot to test for correlation between the percentage of dual infected cells and the percentage of virus bound for each L. johnsonii strain. Data points are the mean values presented in Figures 3C and 1F. p=0.5, R2=0.1, r=0.3 (Pearson’s correlation coefficient calculation). (E) Scatter plot to test for correlation between the percentage of dual infected cells and the total percent of infected cells. Data points are the mean values presented in Figures 3A and 2B. p<0.0001, R2=0.5, r=0.71 (Pearson’s correlation coefficient calculation). (F) Scatter plot to test for correlation between the percentage of dual infected cells and the total percent of infected cells for each L. johnsonii strain. Data points are the mean values presented in Figures 3C and 2D. p=0.5, R2=0.1, r=0.31 (Pearson’s correlation coefficient calculation). See also Figure S3.