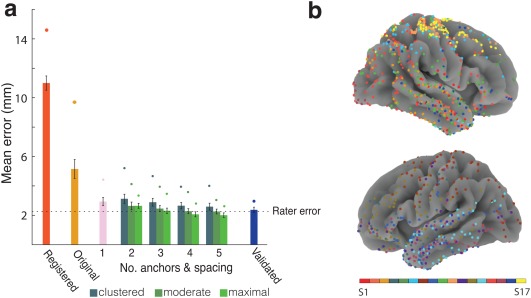
Figure 4.

Algorithm Accuracy. (a) Mean distance between the location of the gold standard electrodes and localization by CT registration alone, original spring optimization without the use of anchor points, and optimization using one or more anchor points. When using more than one anchor point, mean distances are shown for different inter‐anchor distances. Each bar represents the average distance between final electrode locations and the locations of the gold standard electrodes averaged across the primary cohort of participants (with the exception of the “validated” bar, which reports the 5‐anchor, maximally spaced result across the validation cohort). Circles represent participants with maximum localization error, and error bars represent standard error. A dotted reference line is shown at the level of inter‐rater error. (b) Final location of subdural electrodes from all 17 participants color coded by participant and plotted on a population average brain [Color figure can be viewed at http://wileyonlinelibrary.com]
