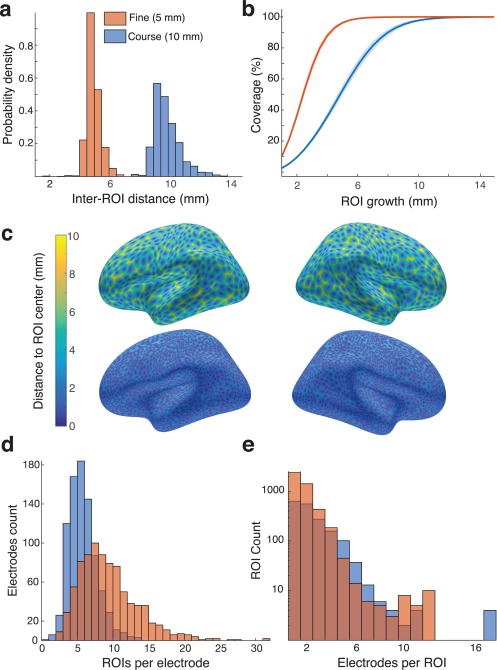
Figure 5.

Regions of Interest. (a) Nearest‐neighbor distance was computed between all ROI centers on the average brain for fine and coarse spacing of the ROI centers. (b) ROIs were grown for each participant until 99.9 percent of the surface was covered. The geodesic radius needed to cover the standard brain is shown for both fine and coarse ROI centers. (c) ROI distribution on the average brain appeared uniform in the coarse (top) and fine (bottom) grids. (d) Each electrode was assigned to the nearest ROIs. Across all participants, the number of ROIs assigned to each electrode is shown as a distribution for both fine and coarse ROIs [Color figure can be viewed at http://wileyonlinelibrary.com]
