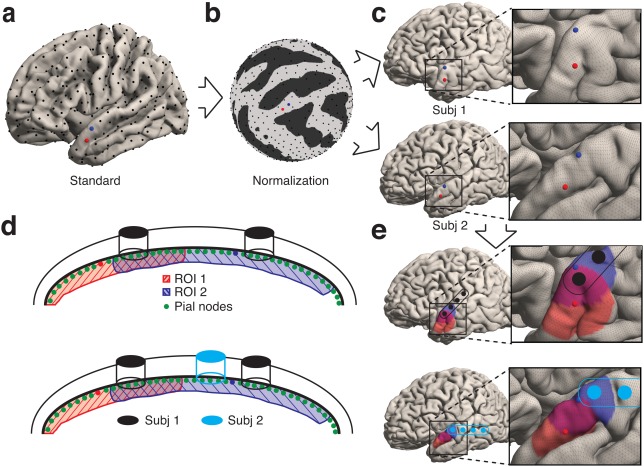
Figure 6.

Electrode Mapping to ROIs. (a) ROI centers were chosen on the average brain with farthest point sampling until desired resolution was reached (coarse grid shown). (b) ROI center sampling was performed on the normalized pial mesh, allowing correspondence between participants. (c) ROI centers across participants are in analogous anatomical locations. (d) Each electrode is assigned to the nearest pial vertices and then to the closest ROIs. (e) ROIs are grown geodesically to cover the surface and frequently overlap. Each ROI detects activity from electrodes within its geodesically grown region [Color figure can be viewed at http://wileyonlinelibrary.com]
