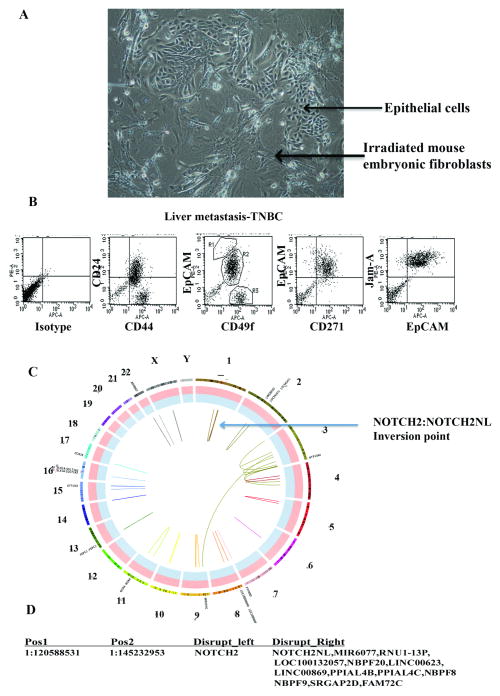
Fig. 2.
Characterization of liver metastasis of a TNBC. A) Phase contract image of metastatic cells grown under reprogramming assay condition. B) Flow cytometry analyses show the presence of cancer stem cell-like (CD44+/CD24-) and basal-like (CD49f+/EpCAM- and CD271+) cancer cells. C) Circos plot showing chromosomal aberrations in liver metastatic cells. Chromosome positions and the region with NOTCH2 aberration are indicated. D) Details of chromosomal aberrations involving NOTCH2. Nucleotide numbers with disruptions are indicated on left and genes affected by these disruptions are indicated on right. Table S3 describes additional mutations.

