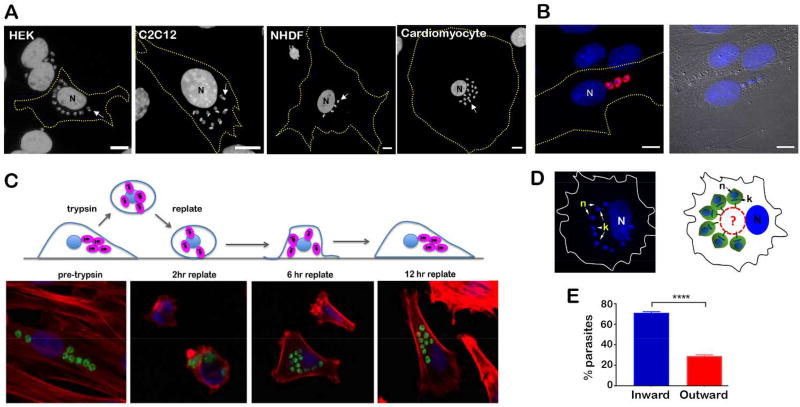
Figure 1. T. cruzi intracellular amastigotes adopt a non-random spatial organization in mammalian cells.
A. Fluorescence microscopy images of T. cruzi-infected human embryonic kidney cells (HEK), mouse myoblasts (C2C12), neonatal human dermal fibroblasts (NHDF) and human cardiomyocytes fixed at 48 hpi and stained with DAPI to visualize host nuclei (N) and parasite DNA (eg. white arrow). Host cell boundaries are depicted by yellow dashed lines. Scale bar = 10 µm. B. Immunofluorescence microscopy performed on fixed T. cruzi-infected NHDF (18 hpi). Intracellular amastigotes were visualized using rabbit anti-T. cruzi serum (red) and DNA is visualized with DAPI (blue). N = host cell nucleus. Scale bar = 10 µm. C. Upper panel: Schematic representation of cell shape and appearance of T. cruzi-infected cells at different times pre- and post-trypsinization and replating onto a tissue culture dish (grey); intracellular T. cruzi amastigotes (pink), host nucleus and host cell membrane (blue). Lower panel: Representative fluorescence images of infected NHDF fixed before (pre-trypsin) or at different times post trypsinization and replating. CFSE-stained parasites (green), host actin filaments (red) and DNA (blue). D. Left panel: Fluorescence image of DAPI-stained T. cruzi-infected NHDF showing parasite organization observed in 15% of the cells at 4 hr post-replating. Right panel: Schematic representation of amastigote orientation toward a non-stained area next to the host cell nucleus (N). k = kinetoplast, n = parasite nucleus. Host cell boundaries are depicted in both panels. E. Bar graph representing the percentage of individual parasites with kinetoplast DNA oriented toward an unstained juxtanuclear space in cells 4 hr post-replating. Only cells harboring parasites arranged in semi-circular pattern around juxtanuclear structures were counted. n = 300 parasites in each of the 3 independent experiments (unpaired Student's t-test, p < 0.0001).

