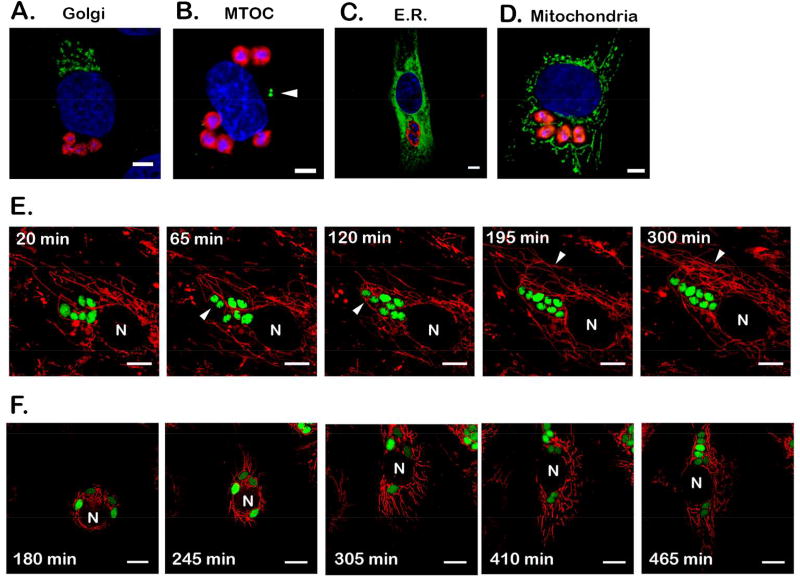
Figure 2. Intracellular T. cruzi amastigotes maintain close proximity with host mitochondria.
(A–D) Representative images of cytosolically-localized T. cruzi amastigotes in NHDF (48 hpi) and host subcellular structures visualized by immunofluorescence microscopy. Parasites are labeled with CFSE (A) or stained with anti-T. cruzi antibodies (red) (B–D). For consistency, parasite images were artificially colored in red and host structures in green. (A) Golgi apparatus (golgin-97 abs), (B) microtubule organizing center (MTOC, white arrowhead) (gamma-tubulin abs), (C) endoplasmic reticulum (sec61β-GFP) and (D) mitochondria (ATP5B abs). DNA is stained using DAPI (blue). Scale bar = 5 µm. The images showing Golgi apparatus (A) and ER (C) were acquired with a confocal microscope. E and F. Time-lapse imaging of unperturbed (E) or freshly replated (F) NHDF expressing mitochondrially-targeted mCherry (red) and infected with GFP-expressing T. cruzi (green) (36 hpi). N = host nucleus. Scale bar = 10 µm. In E, white arrowheads indicate dividing parasites (65 and 120min) and increase in mitochondrial density around parasites (195 and 300min). Time of recording is indicated at the top left corner of each frame with t = 0 arbitrarily set for the first frame of recording (~36 hpi). In F, recording was initiated 180 min post-replating, highlighting the dynamics of the host mitochondrial network in live cells (red) and the proximity between host mitochondria and intracellular amastigotes (green).

