
Figure 3.
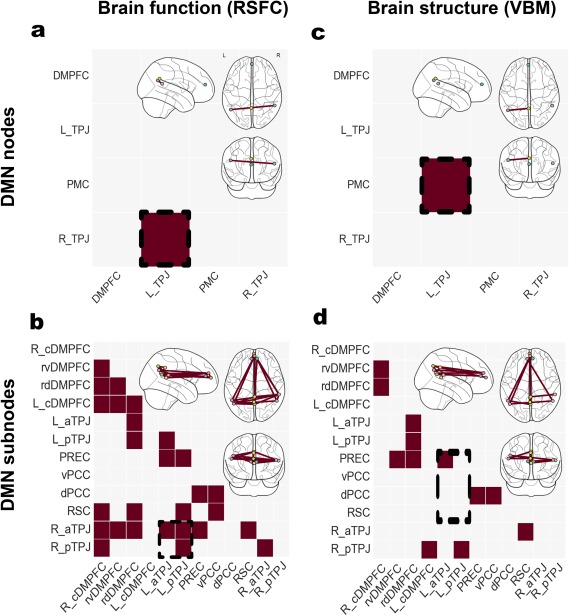
Studying nodes versus subnodes in the DMN. Significant differences in functional connectivity (left column, RSFC) and structural co‐occurrence (right column, VBM). Schizophrenic patients and healthy controls were compared based on the usual DMN nodes (upper row) and the topographically more fine‐grained DMN subnode atlas (lower row). Richer brain signals have been captured by the recent parcellation of the DMN nodes, resulting in a higher number of statistically significant group effects. Analysis approaches based on collapsed DMN nodes may therefore obfuscate disease‐specific patterns in fMRI signals as indexed by resting‐state connectivity and in MRI signals as indexed by VBM. The glass brains were created using the nilearn Python package (Abraham et al., 2014)