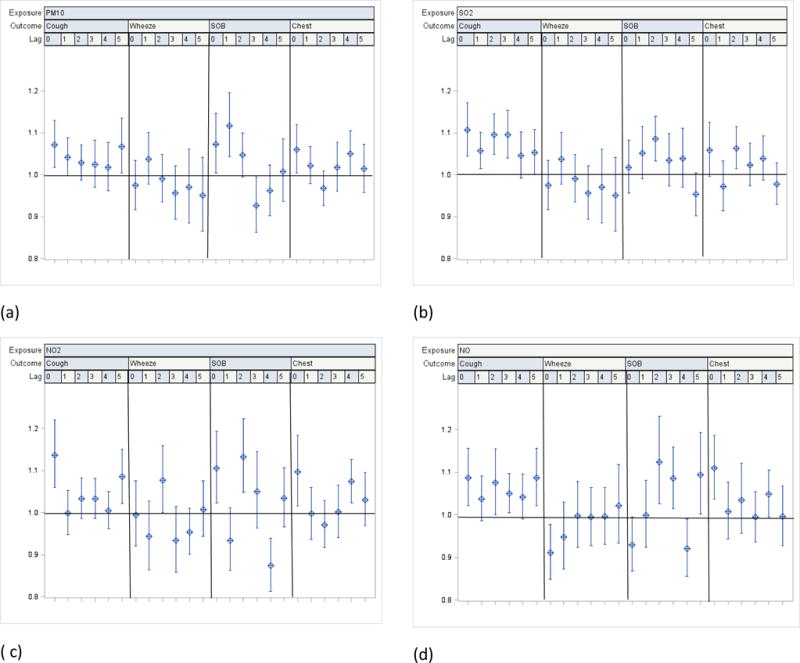
Figure 1.

a–d. Odds ratios for reported symptoms and 95% CI associated with one interquartile range increase in ambient levels of PM10, SO2, NO2 and NO from single pollutant distributed lags covariate-adjusted linear regression models among all participating children (n=432)
Notes:
1 Interquartile range (IQR): PM10: 29.35ug/m3; SO2: 6.98 ppb; NO2: 8.19 ppb; NO: 29.7 ppb.
2 Pollution levels used in regression models combine measured and imputed values
3 Covariates in each model: age, gender, race, school, caregiver smokes, caregiver’s education, household income, phase (season), asthma severity, interactions between asthma severity and exposure
