
Figure 2.
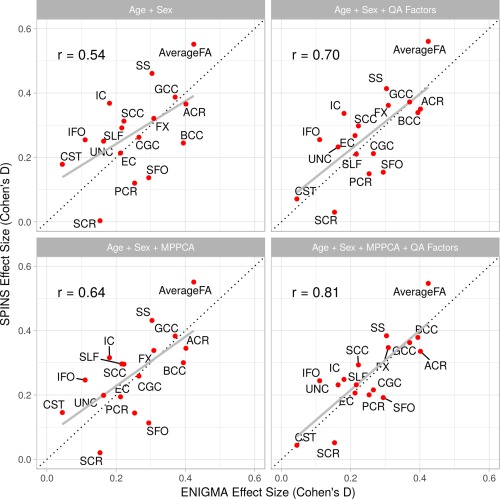
Comparison of regional mega‐analytic effect sizes following inclusion of the QA factors and MP‐PCA denoising [Color figure can be viewed at http://wileyonlinelibrary.com]
Official websites use .gov
A
.gov website belongs to an official
government organization in the United States.
Secure .gov websites use HTTPS
A lock (
) or https:// means you've safely
connected to the .gov website. Share sensitive
information only on official, secure websites.
Comparison of regional mega‐analytic effect sizes following inclusion of the QA factors and MP‐PCA denoising [Color figure can be viewed at http://wileyonlinelibrary.com]