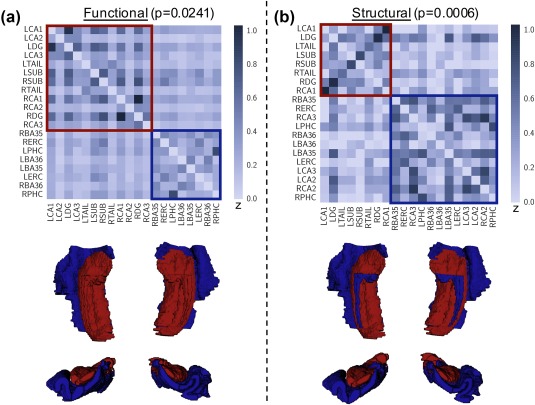
Figure 6.

Detection of (a) functional and (b) structural modules within MTL connectivity matrices, along with visualization of modules mapped onto MTL segmentation. We find that both networks subdivide into two significant modules (structural p = .0241, functional p = .0006, permutation‐based testing), one consisting primarily of hippocampal subfields (red) and the second including all extrahippocampal subregions (blue)
