
Figure 7.
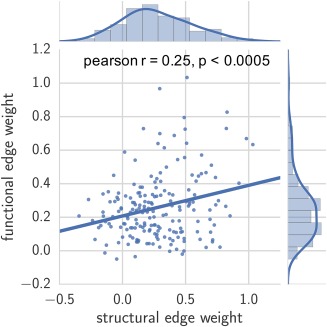
Relationship between functional and structural connectivity networks, measured by Pearson correlation of corresponding edge weights in group‐level functional and structural networks (Pearson r = .25, p < .0005, permutation‐based testing). Distribution of edge weights are also portrayed [Color figure can be viewed at http://wileyonlinelibrary.com]