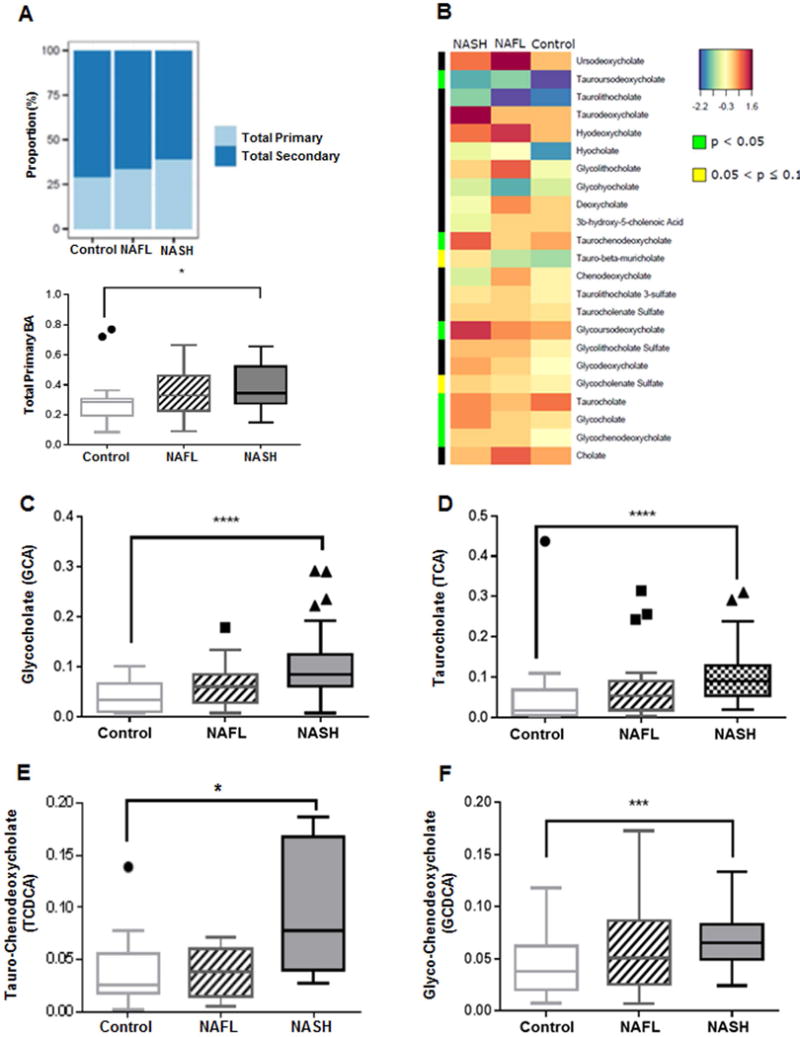
Figure 1. Plasma bile acid profile is significantly altered in NASH.

Data represented as box and whiskers Tukey plot with median and staggered outliers. (A) Stack bar plot representing proportion of total primary and secondary BAs, and box and whisker plot for total primary BAs. (B) Heat map display of the spectrum of BA profile across 3 study groups with orange/reds as larger and blue/greens as smaller measurements. The green color on side bar along the left side of the heat map indicates p<0.05. (C–F) Glycine and taurine conjugates of cholate and chenodeoxycholate. BA, bile acid; *p<0.05, ***p<0.001, ****p<0.0001
