
Figure 3. Distinct primary and secondary plasma bile acid changes in NAFLD and NASH.
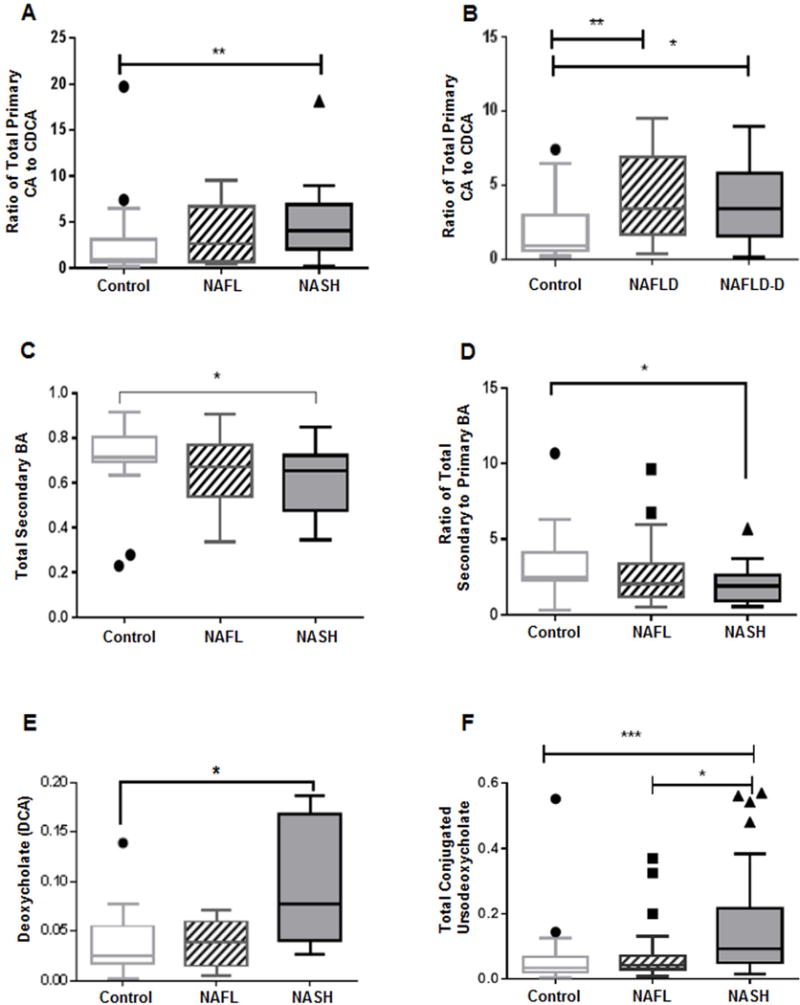
Significantly increased ratio of total primary cholate (CA) to chenodeoxycholate (CDCA) (A) in NASH compared to controls, and (B) in both NAFLD without diabetes and with diabetes vs. controls. (C) secondary BA significantly decreased in NASH. (D) Ratio of secondary to primary BA is significantly lower in NASH. (E) Significantly increased deoxycholate (DCA) in NASH. (F) Patients with NASH had significantly increased conjugated ursodeoxycholate compared to both NAFL and controls. Data represented in box and whisker Tukey plots with medians and staggered outliers. The BA levels were measured against known internal standards in global metabolomics profile and provides a relative quantitative measure of the BAs relative to the library standards across samples. NAFLD-D, NAFLD with diabetes; *p≤0.05, **p<0.01, ***p<0.001