
Figure 7. Plasma bile acid associations with fibrosis in NAFLD.
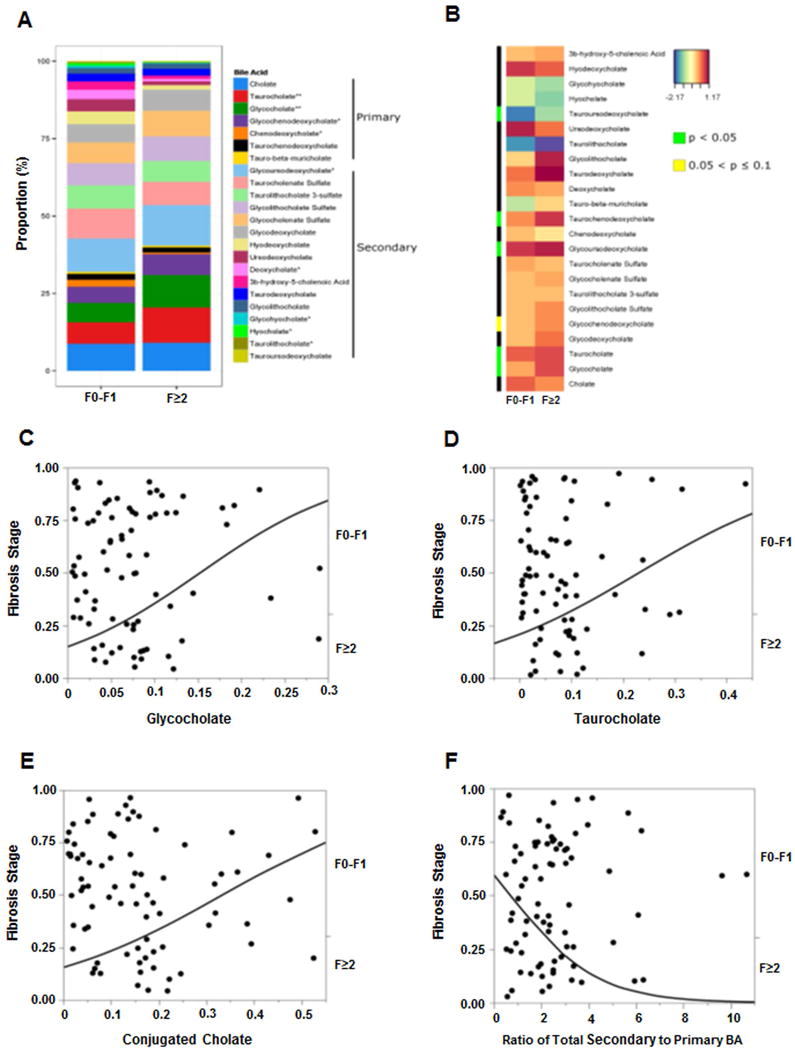
Data represented for fibrosis dichotomized as F0-F1 and F≥2. (A) The stacked bar plot reflects mean bile acids with several significant changes associated with F≥2 fibrosis stage, most notably increased taurocholate and glycocholate. (B) Heat map display of BA profile for fibrosis stage F0-F1 vs. F≥2 with orange/reds indicating larger and blue/greens as smaller measurements. The green color on side bar along the left side of the heat map indicates p<0.05. For panels C–E, the probability of F≥2 was significantly higher on nominal logistic regression with increasing (C) glycocholate, (D) taurocholate, and (E) conjugated cholate. (F) Increasing total secondary to primary BAs ratio had lower likelihood of F≥2 fibrosis. The BA levels were measured against known internal standards in global metabolomics profile and provides a relative quantitative measure of the BAs relative to the library standards across samples.