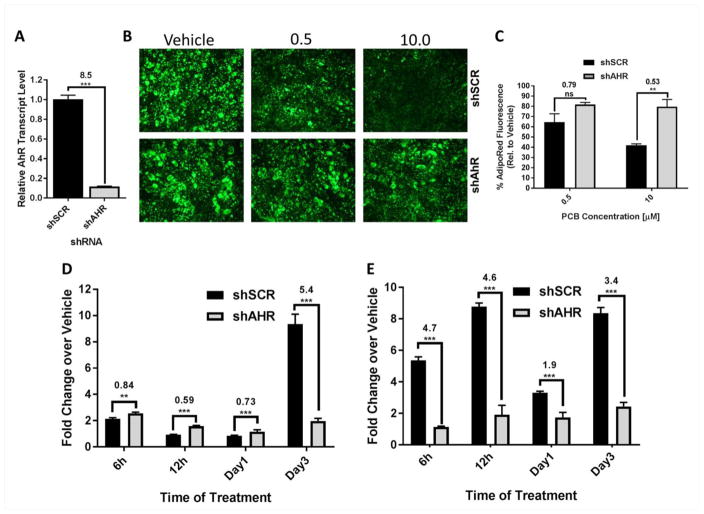
Fig. 5.
AhR knockdown cells are refractory to PCB126 induced inhibition of adipogenesis and IL-8 induction. (A) Quantitative RT-PCR demonstrated that AhR was knocked down to by shRNA (shAhR) to a level that was ~90% that of scrambled control (shSCR). The calculated fold change compares transcript levels of shSCR to shAhR cells. (B) Preadipocytes expressing scrambled control shSCR or shAhR were treated with different doses of PCB126 and cells were differentiated (see diagram, figure 1c) and stained with AdipoRed. (C) AdipoRed fluorescence was quantified in four different fields using ImageJ software. Percentage is relative to vehicle-treated cells. (D) Preadipocytes were treated with PCB126 at 0, 0.5 or 10 uM (see diagram, figure 1b) and quantitative RT-PCR was used to assess IL-8 transcript levels in PCB126 treated preadipocytes over a time course. Values represent fold changes over vehicle controls. Three assay replicates were performed and averaged. (E) Quantitative RT-PCR of CYP1A1 transcript levels in the same samples as in “D”. Statistics comparing shSCR versus shAhR were performed as described in the Materials and Methods. Values over statistics bars represent the fold-difference of shSCR over shAhR. **=p<0.01; ***=p<0.001.

