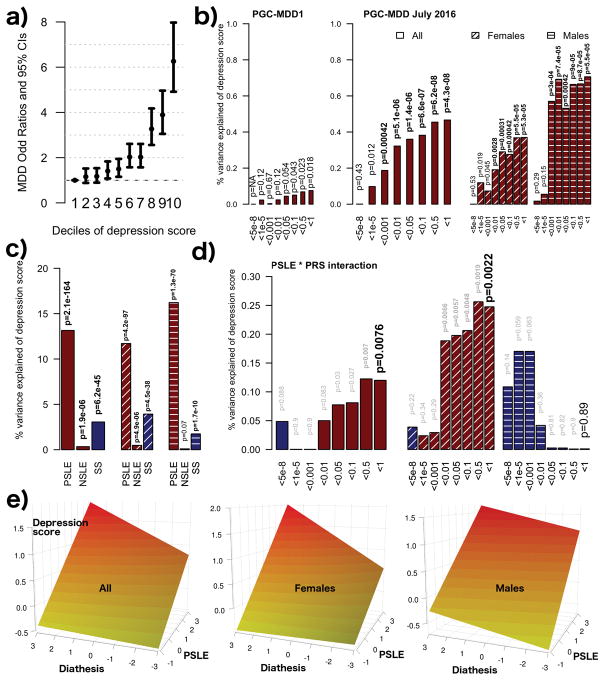
Figure 1.
(a) Increased odds of DSM IV MDD diagnosis per decile of depression IRT score assessed 4–7 years previously. (b) Association between MDD-PRS and depression scores (main effects, one-sided tests, results expressed in % of variance explained). Full sample analyses using the two versions of the PRS were run in the same target dataset with the exact same covariates. Red bars indicate positive correlation with the depression score. PRS were calculated using different p-value thresholds from the GWAS summary statistics. The most conservative only includes independent loci with genome wide significant SNPs (p-value<5e-8), while the least conservative include the most significant SNP of each haplotype (p-value<1). (c) Association between self-reported stress (personal stressful life events (PSLE) or network stressful life events (NSLE), lack of SS) and depression IRT score (main effect, one-sided tests, results expressed in % of variance explained). Blue bars indicate negative correlations and red bars indicate positive correlations with the depression score. Dashed bars indicate sex specific effects. (d) Variance of the depression score explained by the interaction between PRS and PSLE (2-sided tests). Dashed bars indicate sex specific effects. We focused on the association with the PRS comprising all haplotypes but the other associations are also reported for completeness. Blue bars indicate negative correlations and red bars indicate positive correlations with the depression score. (e) Increase in depression score (fitted values, vertical axis) as a function of PSLE and MDD-PRS. For example, the effect of the PSLE-diathesis interaction is visible when comparing the bottom (minimal PSLE) and top (maximal PSLE) edges of the surface. The difference in slopes indicates that PSLE mediates the effect of the genetic predisposition on the depression score. From right to left, results for the whole sample, females and males. In all analyses, we accounted for familial relatedness using a kinship matrix (a) or a genetic relatedness matrix calculated from SNPs (b–d). For (a) we used R package “hglm” 77 to estimate the odds ratios (student test to test the significance of the fixed effects). For panels (b–d) the parameters of the model were estimated using GCTA 1.26.0 (student test to test the significance of the fixed effects) 62. All analyses controlled for age, age2, sex, age*sex and age2*sex interactions, study, array, and the first four genetic principal components in the outcome variable and predictors 60.

