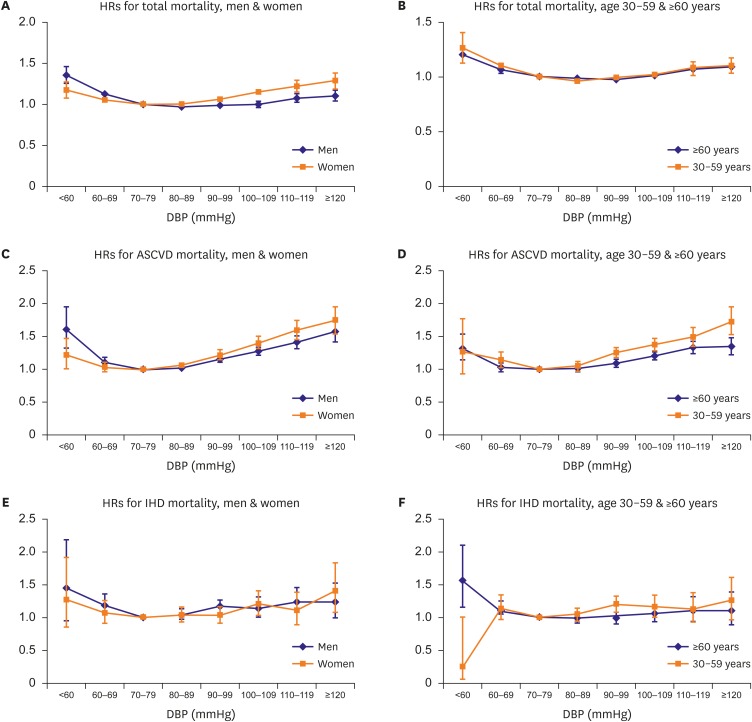
Figure 1.
HRs from multivariable adjusted model of total, ASCVD, and IHD death by DBP categories stratified by sex and age. Multivariable adjusted HRs for total, ASCVD, and IHD mortality by 8 categories of DBP stratified by sex and age. The referent category for DBP was 70–79 mmHg. Each dot indicates HRs, and vertical lines over the dots mean 95% CIs. Age was divided into 2 groups: 30–59 years and 60 years or older (range: 60–95 years). (A, C, E) Blue line shows results in men, and orange line in women. (B, D, F) Blue line means ≥60 years age group, and orange line means 30–59 years age group. The y-axis scale was different for the 3 outcomes (0–2.0 or 0–2.5).
ASCVD = atherosclerotic cardiovascular diseases; CI = confidence interval; DBP = diastolic blood pressure; HR = hazard ratio; IHD = ischemic heart disease.

