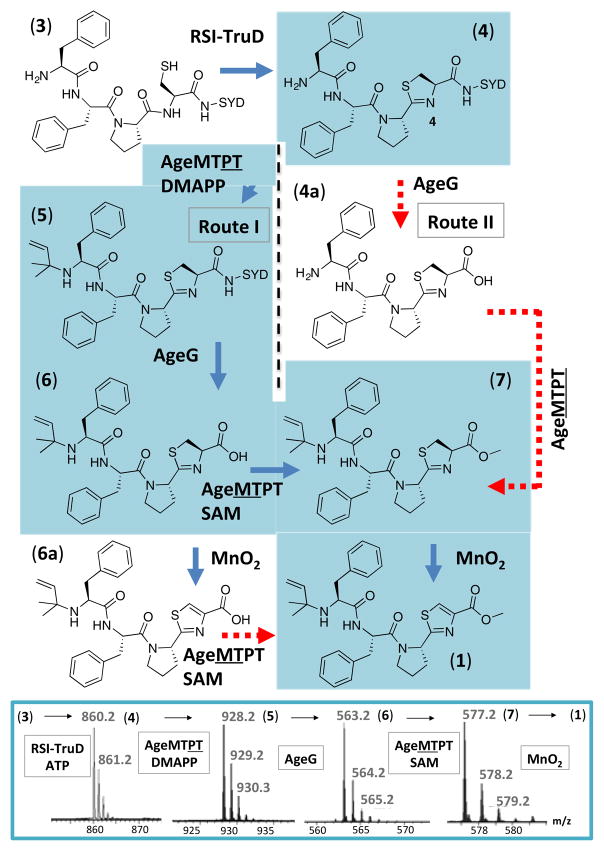
Figure 2.
Synthesis and biosynthesis of aeruginosamide B (1). Blue arrows indicate steps that worked using recombinant enzymes and pure chemicals. Red dashed arrows indicate minimal (or no) reactions. The metabolic pathway was determined on the basis of these reactions and previous knowledge of cyanobactin biosynthesis. At bottom are shown mass spectra [M+H]+ of species 4–7. Additional data in: Figures S2, S12, S13 and Tables S1–3.

