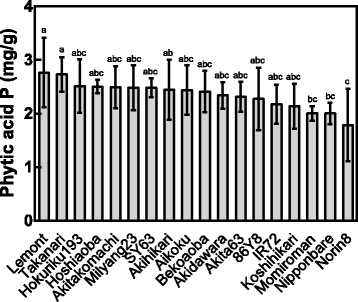
Fig. 1.

PA-P content of different rice cultivars. The raw data were taken from experiments conducted in Tsukuba, Japan (Dietterich et al. 2015). The average value of the PA-P content and standard deviation for each cultivar are presented in the figure. Means followed by the same letter denote no significant differences according to Tukey’s test (P < 0.05)
