
Fig. 2.
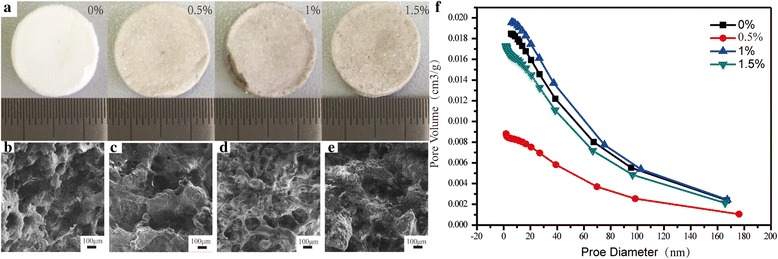
a Optical image of the synthesized nHAC/PLGA/GO scaffolds with different amount of GO. b–e SEM images of b nHAC/PLGA, c nHAC/PLGA/GO (0.5 wt%), d nHAC/PLGA/GO (1.0 wt%), and e nHAC/PLGA/GO (1.5 wt%) scaffolds. f Hole distribution of nHAC/PLGA/GO(0, 0.5, 1.0, and 1.5 wt%)