
Fig. 4.
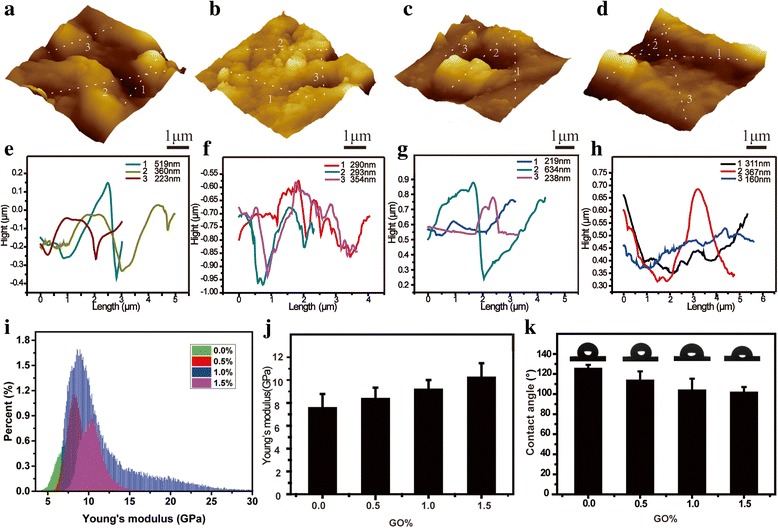
AFM images of a nHAC/PLGA, b nHAC/PLGA/GO (0.5 wt%), c nHAC/PLGA/GO (1.0 wt%), and d nHAC/PLGA/GO (1.5 wt%) scaffolds. e–h Line profiles derived from the morphology images. i Stiffness distribution of the four different scaffolds measured by QNM-AFM. j The bar chart of Young’s modulus versus the GO amount. k The corresponding contact angles of four kinds of scaffolds measured by the sessile drop method