
Fig. 6.
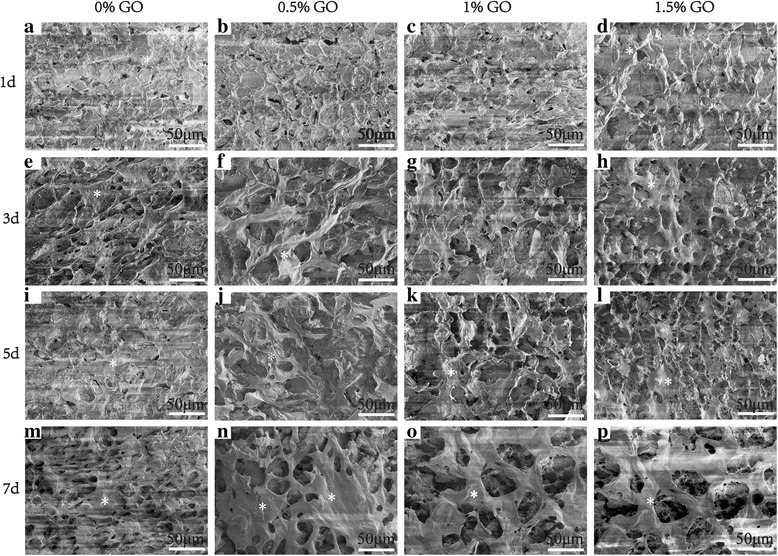
a–p SEM images of MC3T3-E1 cells cultured on four different scaffolds for 1, 3, 5, and 7 days. Scale bars are 50 μm in all images.The white asterisk represents the MC3T3-E1 osteoblast cells
Official websites use .gov
A
.gov website belongs to an official
government organization in the United States.
Secure .gov websites use HTTPS
A lock (
) or https:// means you've safely
connected to the .gov website. Share sensitive
information only on official, secure websites.
a–p SEM images of MC3T3-E1 cells cultured on four different scaffolds for 1, 3, 5, and 7 days. Scale bars are 50 μm in all images.The white asterisk represents the MC3T3-E1 osteoblast cells