Fig. 2.

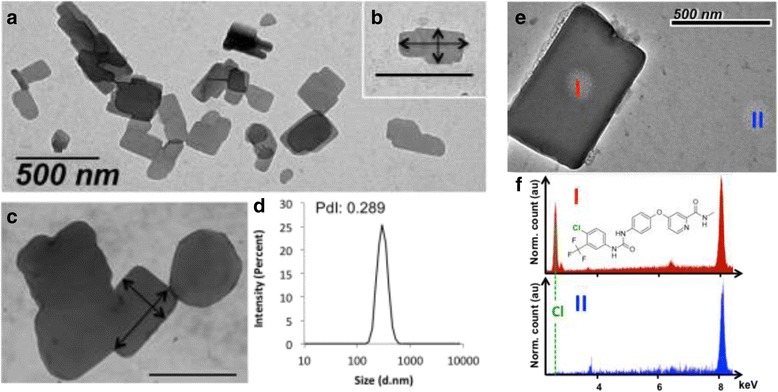
SLNs characterization. Transmission electron microscopy (TEM) images showing the morphology of sorafenib nanoparticles with DOTAU (a) and inset (b). Example of a DOTAU-based SLN featuring a size of 327 by 172 nm (arrows), which confirm an average size of 304 nm as measured by DLS (d). c Example of TEM image showing diC16dT-SLNs (arrows 330 by 500 nm, respectively). (e) TEM image of a SLN-. I & II spots are the localisations where EDX acquisitions was performed. (f) EDX spectra at I & II positions. Dashed line emphasized the emission of chlorine atom, which is only present in I. Chemical structure of Sorafenib molecule is also presented. Both spectra were normalized with Cu atom emission at 8 keV (due to TEM Cu grid)
