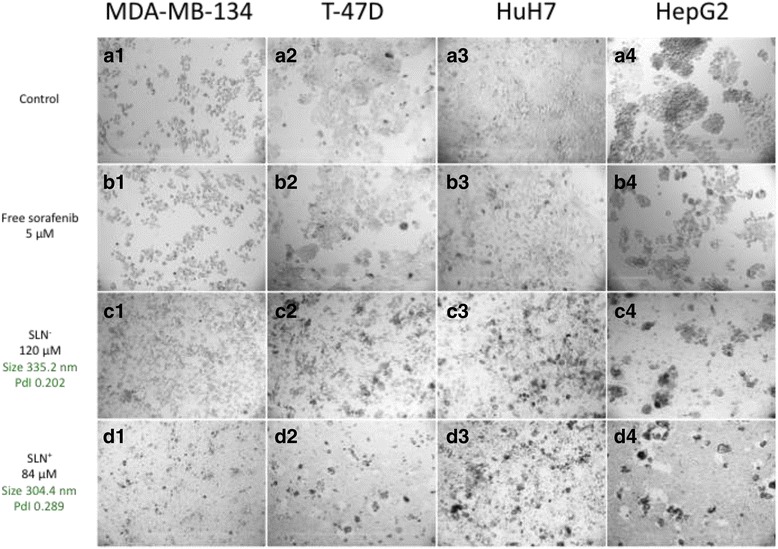
Fig. 5.

Comparison of cells morphologies between control, free sorafenib, or SLNs. Phase contrast microscopy images showing cytotoxicity in different conditions on four human carcinoma cell lines (the hepatocarcinomas, HuH7, HepG2, and the luminal breast carcinoma MDA-MB-134, T-47D). A) In the absence of sorafenib (control experiments, A1–A4 for MDA-MB-134, T-47D, HuH7, HepG2, cell lines, respectively). B) Cells were incubated for 4 days in the presence of 5 μM of free sorafenib. C and D) cells incubated in the presence of SLN− and SLN+ at 84 and 120 μM in concentration of sorafenib, respectively
