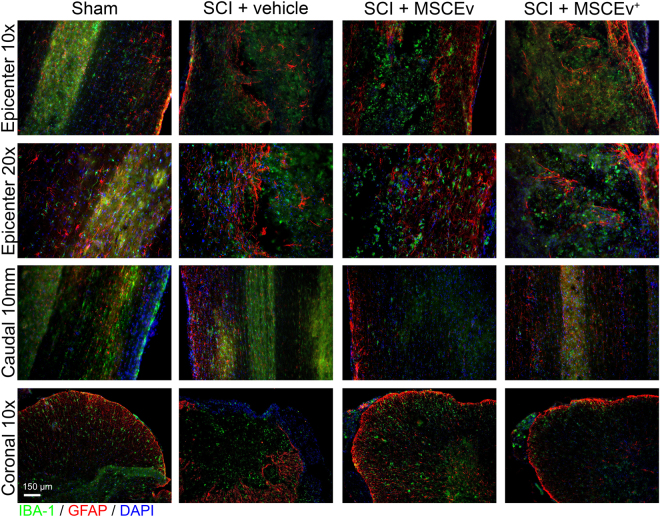
Figure 6.
Longitudinal and coronal sections of spinal cord at 14 days post-injury were stained for Iba-1 (microglia, green), GFAP (astrocytes, red), and DAPI (nuclei, blue) and analyzed for neuroinflammation. Longitudinal sections were 40 μm in thickness while coronal sections were 12 μm thick. Representative images of the injury epicenter and a region 10 mm caudal to the epicenter are displayed above. Qualitative analysis revealed increased activation of microglia and astrocytes in injured tissues that appear to be less abundant in those from MSCEvwt and MSCEv+ animals. Areas 10 mm caudal to the epicenter also exhibited activation of microglia and astrocytes, however, the decrease in activation is more noticeable in sections from MSCEvwt and MSCEv+ treated animals. In coronal sections, prominent reactive astrocytes and microglia are visible in vehicle-treated animal tissues while there is much less reactivity in MSCEvwt treated animal tissues, which is especially profound in the tissue of MSCEv+ treated animals. Sham + Vehicle, n = 2, SCI + Vehicle, n = 2, SCI + MSCEvwt, n = 3, SCI + MSCEv+, n = 3.

