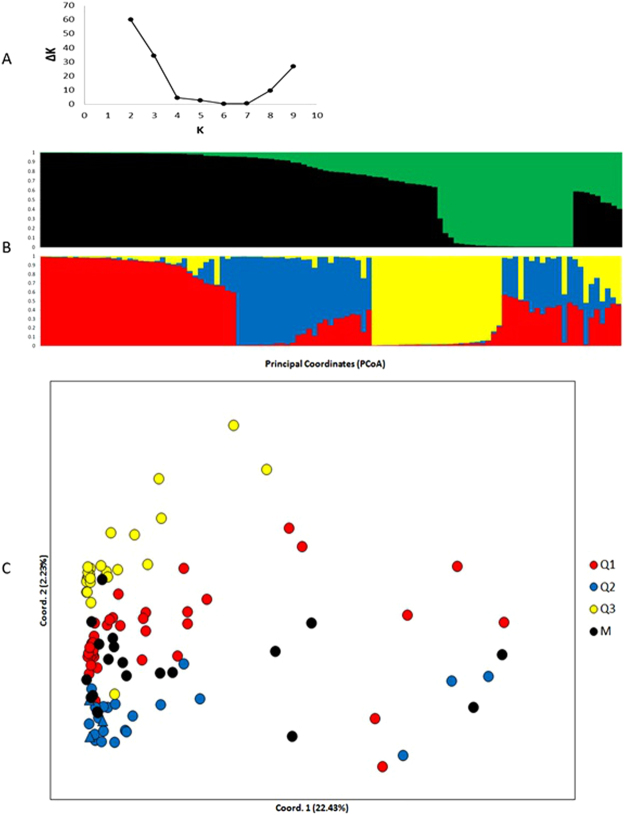
Figure 1.
Population structure among 107 Coffea arabica accessions. (A) Evolution of ΔK values (y-axis) according to the number of genetic groups (x-axis), (B) barplot of the estimated membership coefficient (Q) of the 107 different accessions based on the 2,587 SNP for the K = 2 and K = 3, and (C) principal coordinate analysis (PCoA). In the PCoA individuals are coloured according to the STRUCTURE groups using K = 3. M group individuals are coloured in black.

