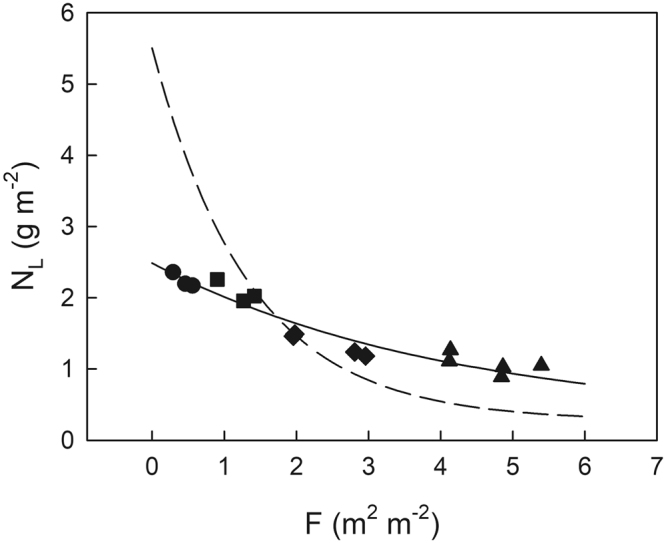
Figure 1.

Actual leaf N (NL) distribution in the canopy of Japanese oak as a function of the leaf area index cumulated from the canopy top (F). Dashed line indicates optimal NL distribution. Leaves were classified into four types based on their growth light environments (Qint): (1) deep shade (triangle, 0 < Qint < 3 mol m−2 day−1), moderate shade (diamond, 3 < Qint < 15 mol m−2 day−1), moderate sun (square, 15 < Qint < 25 mol m−2 day−1), and typical sun leaves (circle, 25 < Qint < 35 mol m−2 day−1).
