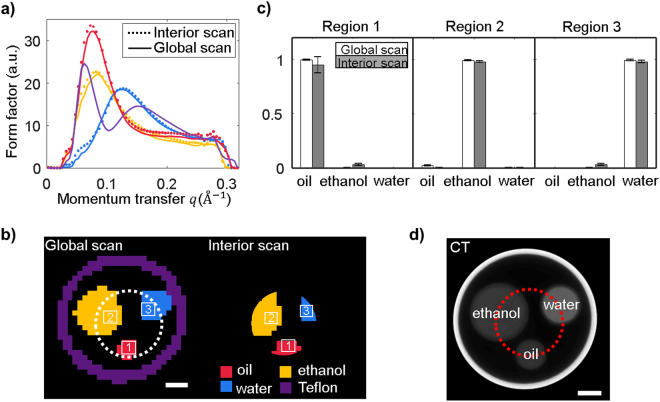
Figure 2.
Comparison between the reconstruction from full-FOV and interior XDT scan. (a) Reconstructed form factor from global and interior XDT scan compared with reference form factor of each material. (b) Material map of the global and interior scan. (c) Classifiers in boxed regions marked by the numbers in (b). The bin and error bar indicate the average and standard deviation of the probability within each region. (d) Conventional CT reconstruction. The scale bars represent 5 mm.

