Fig. 2.
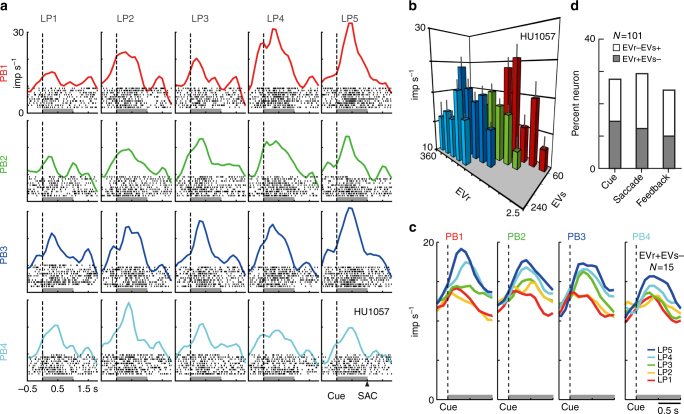
Relative value signals in the activity of mOFC neurons. a Rasters and histograms of an example mOFC neuron modulated by the relative value of options. The activity aligned at cue onset during free choice trials was shown for 20 lottery pairs (four PBs times five LPs, 200 trials). Black dots in the histograms indicate raster of spikes. Gray bars indicate the cue period to estimate the neuronal firing rates shown in b. SAC indicate approximate time of saccade onset. b Activity plot of the mOFC neuron in a against the expected values of risky (EVr) and safe option (EVs). Error bars indicate s.e.m. The neuron showed positive and negative regression coefficients for EVr and EVs (EVr+EVs− type, EVr, 0.042, EVs, −0.048, AIC = 1283), respectively. c Activity histogram of 15 mOFC neurons modulated by relative values of risk and safe options during cue period (EVr+EVs– type). Activity in each of four payoff blocks (PB1–4) is shown for the five types of lottery pairs (LP1–5). d Percentage of mOFC neurons modulated by relative values during three task periods. Gray indicates activity showing the positive and negative regression coefficients for EVr and EVs, respectively (EVr+EVs− type). White indicates activity showing negative and positive regression coefficients for EVr and EVs, respectively (EVr−EVs+ type)

