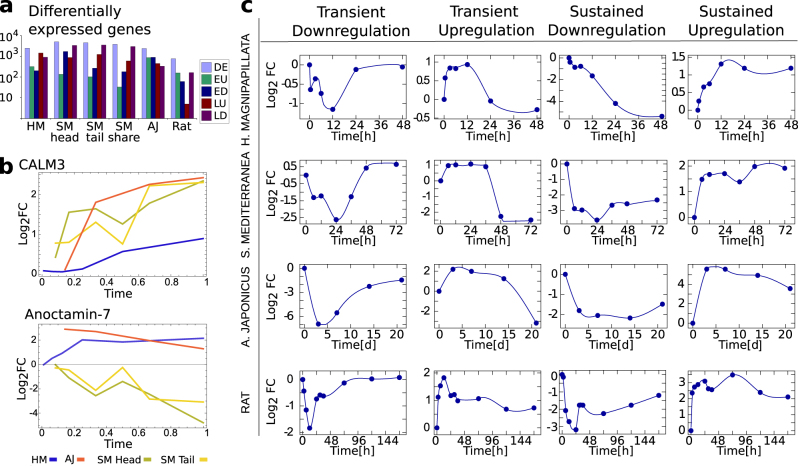
Fig. 2.
Pattern of expression of DE genes. a Total number of DE genes and early/late upregulated (EU/LU) and downregulated (ED/LD) genes for the considered organisms. The expression profile of S. mediterranea head and tail regenerations is considered separately, as well as the DE genes shared between the two processes. b The expression profile of two illustrative human genes DE in all the considered regeneration processes. Calmodulin show a coherent expression profile among organisms, while Anoctamin-7 is differentially expressed in the organisms. Time is rescaled and normalized in order to make the timescales comparable. c Figure shows the average expression level as a function of time of exemplificative clusters of genes resulting transiently down/upregulated and continuously down/upregulated during the regeneration process for H. magnipapillata, S. mediterranea, A. japonicus, and rat

