Figure 3.
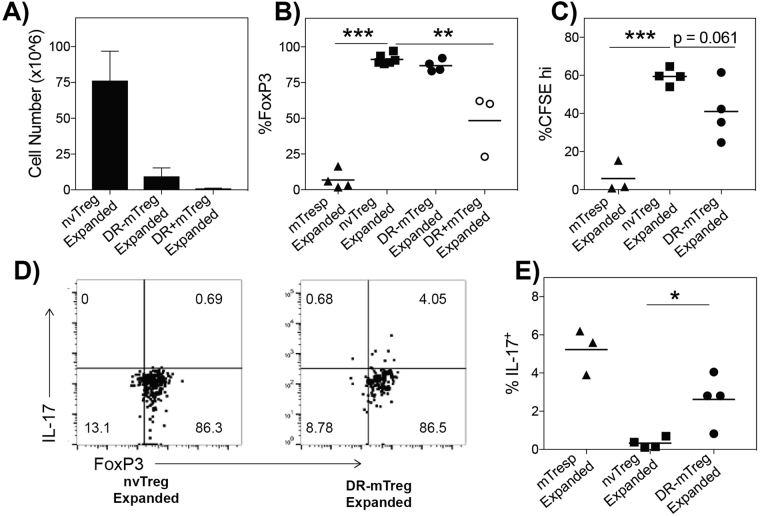
The different Treg subsets exhibit unique capacities to undergo in vitro expansion with maintained FoxP3 expression and suppressive activity. (A) The number of T cells that were produced after a 14d in vitro stimulation is shown (n = 3). The expanded T cell populations were tested for (B) expression of intracellular FoxP3 to indicate purity; and (C) for their ability to suppress CFSE labeled mTresp when co-cultured at a 1:1/2 (mTresp:Treg) ratio with αCD3/APC stimulation. (D) Shows representative intracellular staining of the expanded Tregs for co-expression of FoxP3 and IL-17. (E) The frequency of IL-17 producing, FoxP3+ cells in the DR−mTreg versus the nvTreg populations (n = 4) is shown. Data shown are mean ± SEM. Significance, determined by Student’s t test, is indicated by (*P < 0.05), (**P < 0.01), and (***P < 0.001).

