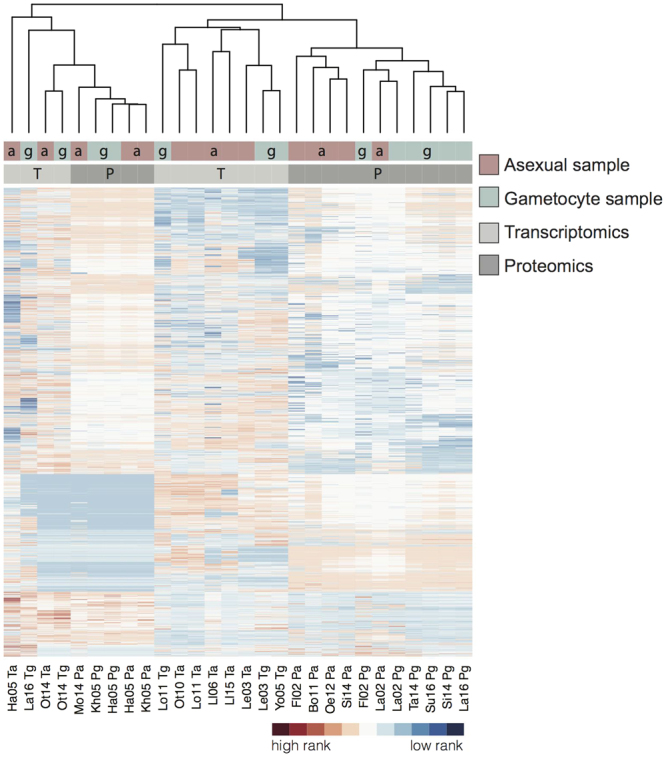
Figure 1.

Clustered data sets used in this study with genes ranked according to their protein or transcript expression. Level of expression as detected in the respective samples with unique peptide counts for MS data and percentiles for transcriptomics. The studies are clustered using complete linkage according to their overall gene expression similarities (Euclidean distance). See Table 1 for study keys. Distribution of asexual(a)/gametocyte (g) samples (red/blue) is shown in top bar, proteomics (P) and transcriptomics (T) (dark/light grey) in lower bar.
