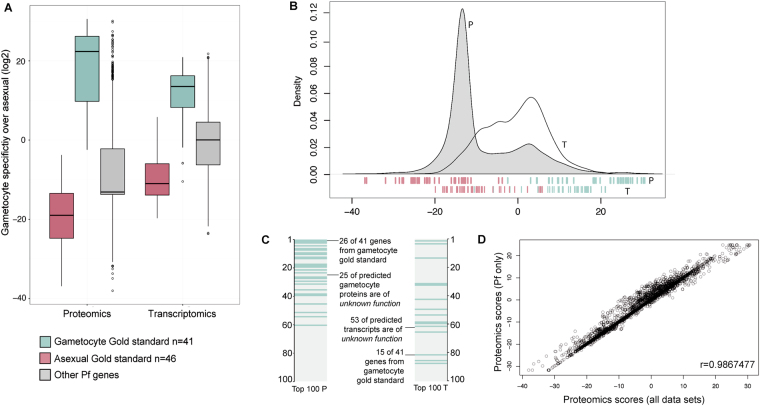
Figure 2.
Gametocyte-specificity scores for P. falciparum genes derived from proteomics (P) and transcriptomics (T) data sets. (A) Boxplot for integrated scores for the two gold standard sets and all other Pf genes, derived from proteomics, transcriptomics or all data sets (combined). (B) Density of P and T gametocyte scores, individual gold standard genes and their scores are indicated at the bottom (red, asexual, blue gametocyte). (C) 100 highest ranking proteins and transcripts, gametocyte gold standard in blue. (D) Correlation of the gametocyte-specificity scores derived from all integrated MS studies and Pf MS studies only.

