
Figure 3.
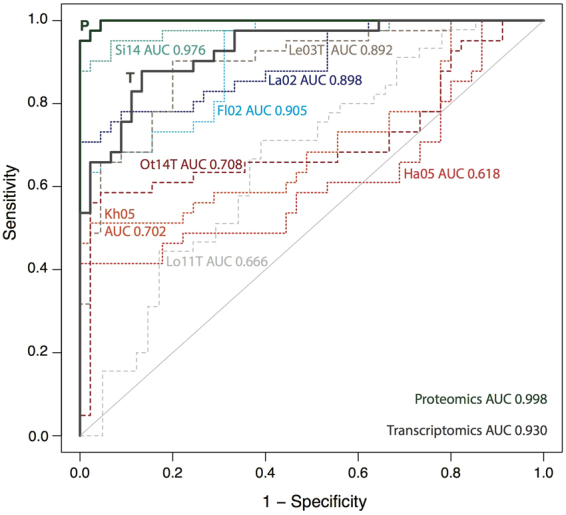
Validation of Bayesian gametocyte scoring with area under the curve (AUC) values. Integrated data and individual data sets are compared by 10-fold cross-validation (subsampling of gametocyte and asexual gold standard sets). Integrated proteomics (P) and transcriptomics (T) scores in bold lines. P. berghei data sets in shades of red, individual proteomics and transcriptomics studies with short and long dashes, respectively. See Table 1 for study keys.