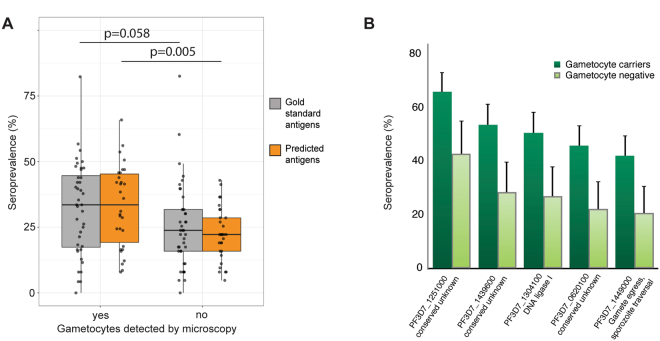
Figure 5.
Seroprevalence in two cohorts of parasite carriers in The Gambia. (A+B) Antibodies against the highest scoring gametocyte-specific proteins were measured on protein microarrays. Comparison of positivity (mixture-model cutoff) in gametocyte carriers (n = 164) and non-carriers (n = 63). Gametocyte presence determined by microscopy. All individuals were positive for asexual parasites. (A) Prevalence of antigens from the gold standard (n = 40) and predicted gametocyte-specific proteins (n = 30), Mann-Whitney U test (B) Antigens of five predicted gametocyte-specific proteins are preferentially recognized by gametocyte carriers. Error bars indicate the upper limit of the 95% confidence interval around the proportion. p < 0.05 Fisher’s exact test, corrected for multiple testing of a total of 70 antigens (Benjamini-Hochberg).

