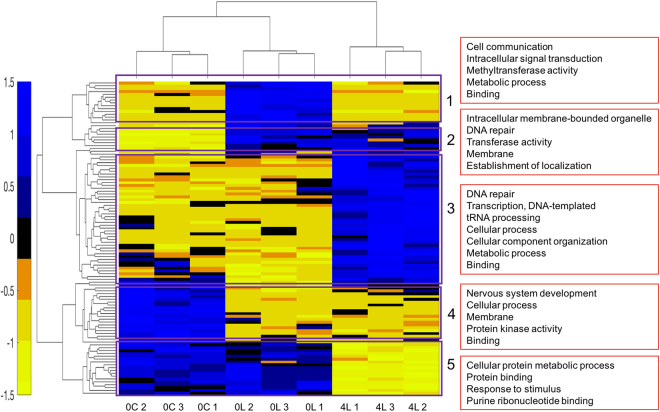
Figure 3.
Hierarchical clustering of brain gene expression levels in bees with different learning and memory status. Each column represents a sequencing sample and each row represents a gene. Gene expression values are colour coded: blue indicates higher expression and yellow indicates lower expression. The normalized gene expression values of 110 differentially expressed genes were used for hierarchical clustering. It is evident that samples in each experimental group can be clustered together and 0-hour Control group and 0-hour Learning group had more similar gene expression patterns. In addition, several gene expression patterns were found and five of them stood out, as highlighted with purple rectangles. Red boxes on the right show the main GO terms for each cluster and the full list of GO terms in each cluster was shown in Supplementary File S3. 0 C: 0-hour Control; 0 L: 0-hour Learning; 4 L: 4-hour Learning.

