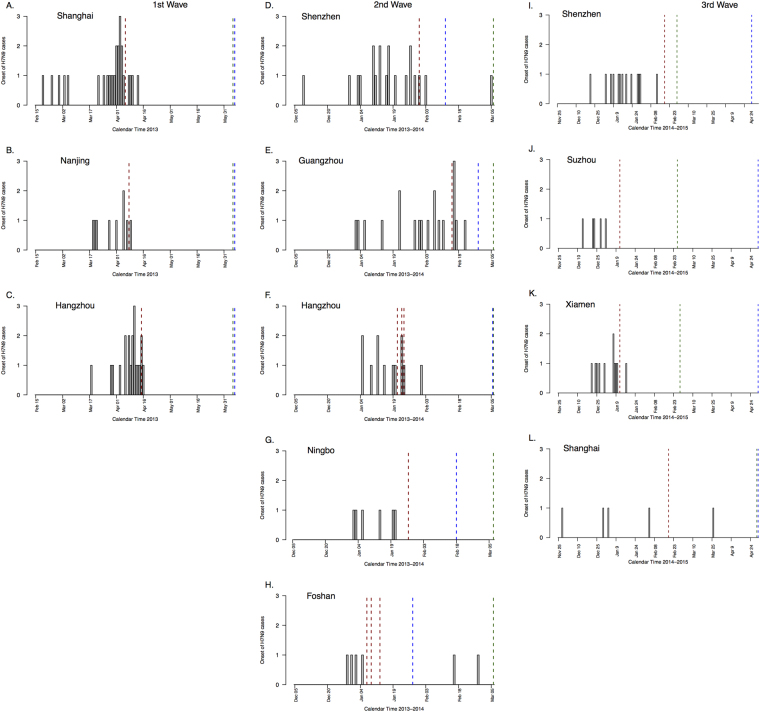
Figure 2.
Dates of influenza A(H7N9) urban cases and LPM closures in Shanghai, Nanjing and Hangzhou during the first wave (February 2013 – June 2013), in Shenzhen, Guangzhou, Hangzhou, Ningbo and Foshan area during the second wave (December 2013 – March 2014) and in Shenzhen, Suzhou, Xiamen and Shanghai area during the third wave (November 2014 – May 2015). The grey bar for each day indicates the number of laboratory-confirmed cases with onsets on that day. Red vertical lines indicate the dates of closures of live poultry markets in each area (markets in Guangzhou and Foshan areas were closed on different dates during the second wave), blue vertical lines indicate the last date used for each area in analyses and green vertical lines indicate the last day of time horizon.

