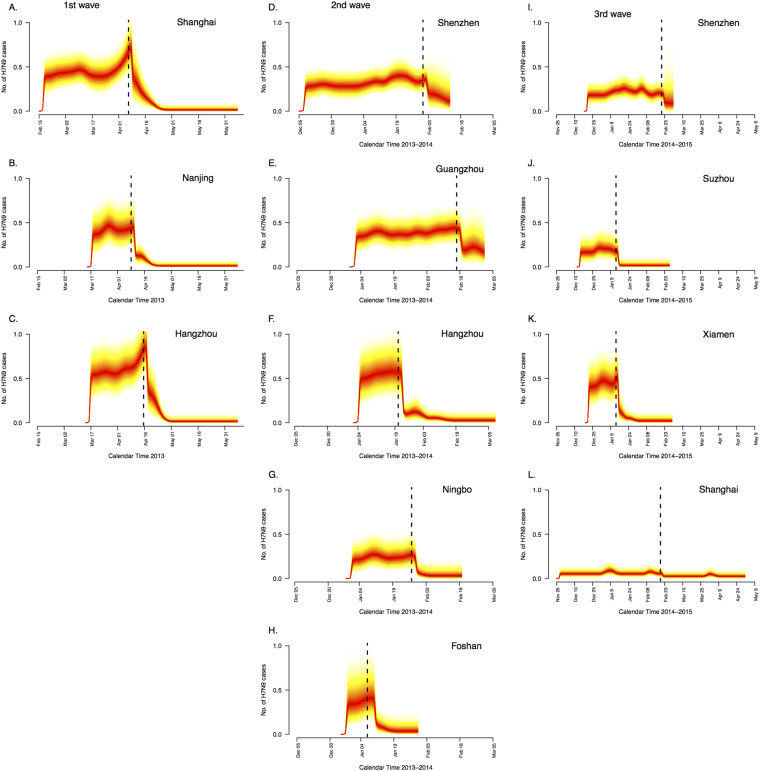
Figure 3.
Posterior estimates of the mean daily number of illness onsets of A(H7N9) cases during the first wave in Shanghai, Nanjing and Hangzhou area, the second wave in Shenzhen, Guangzhou, Hangzhou, Ningbo and Foshan area and the third wave in Shenzhen, Suzhou, Xiamen and Shanghai. Darker colors indicate regions with higher posterior density on a given day. Black vertical lines indicate the dates of closures of live poultry markets in each area (markets in Guangzhou and Foshan areas were closed on different dates during the second wave).

