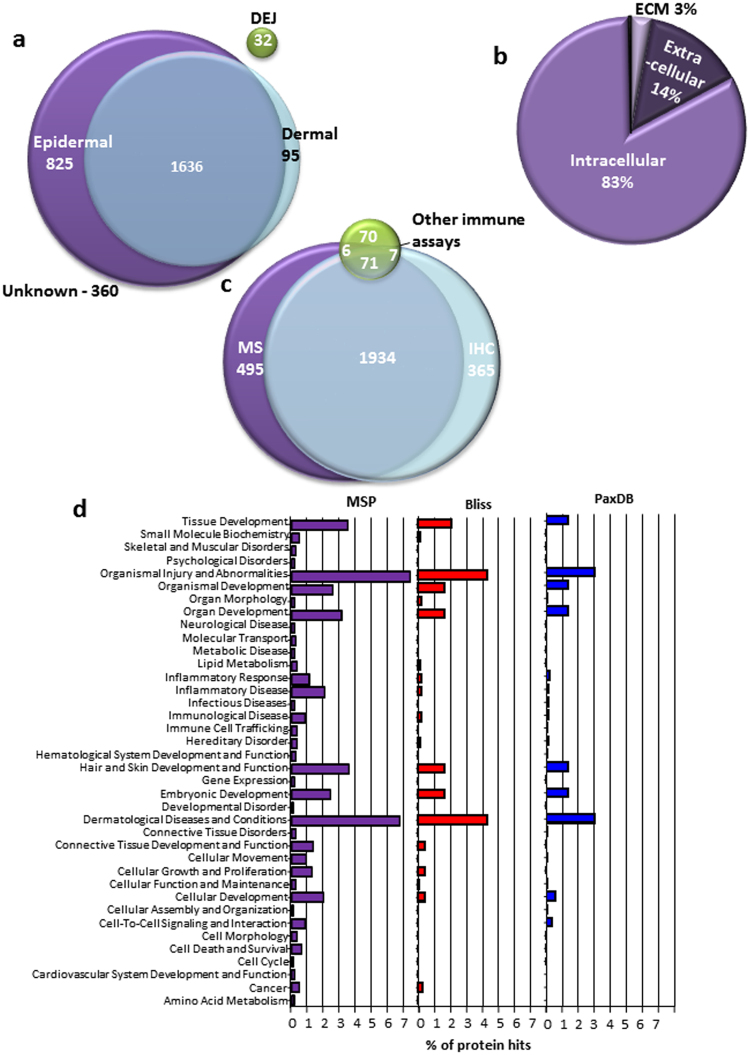
Figure 4.
Analysis of The Manchester Skin Proteome. We analysed the data present in our proteome of 2948 proteins. (a) Shows the tissue location of the proteins evidenced where information was available within the manuscript. The unknown proteins have been evidenced using only Mass Spectrometry techniques. (b) Using GO terminology the subcellular location of each of our proteins was collected, this data is very similar to the patterns observed in the other proteomes where the fewest number of proteins are found in the ECM. (c) Finally we assess the techniques used to evidence protein presence, Mass Spectrometry has evidenced the highest number of proteins, and crucially we have duel evidenced 2011 proteins by both Mass Spectrometry and Immuno-based techniques. (d) Ingenuity was used to count the number of gene hits in each of the top level Kegg pathways for the MSP, Bliss and PaxDB. We standardised these values as a percentage of hits based on the total number of proteins in each database. Whilst the pattern of observed hits in each of the functional groups in similar across each proteome, the MSP contains more hits than any other database showing a more complete profile of tissue function.

