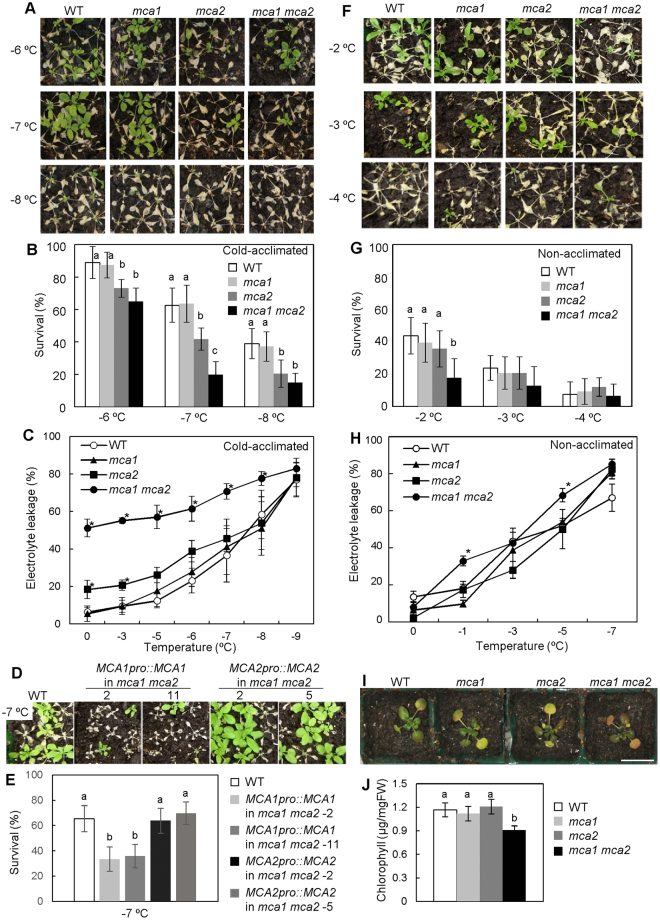
Figure 4.
The mca1 mca2 double mutant exhibited sensitivity to cold stress. (A) Freezing sensitivity of the mca1 mca2 double mutant after cold acclimation. Three-week-old plants were incubated at 4 °C for 1 week, then plants were used for freezing treatment. Photographs are representative plants 7 days after 4-h exposure to the indicated temperature. (B) Survival rates were determined for 9 plants after freezing treatment at the indicated temperature. The survival ratio was calculated from 9 plants per pots. Data represent the means ± SD calculated from the data of 9 independent experiments. Differences between the values of each treatment were evaluated by one-way ANOVA followed by the Tukey-Kramer test. Difference of alphabet letters at each temperature indicates statistically significant difference (p < 0.05). (C) Electrolyte leakage from cold-acclimated wild-type, mca1, mca2, and mca1 mca2 plants after exposure to the indicated temperature (programmed to cool at a rate of 2 °C h−1). Data represent the means ± SD (n = 4 leaves, each from a different plant). *p < 0.05 compared with the value of wild type at each temperature (one-way ANOVA followed by the Tukey-Kramer test). Data were representative experiments from 3 biological independent experiments. (D) Freezing sensitivity of the mca1 mca2 double mutant harboring MCA1pro::MCA1 (lines #2 and #11) or MCA2pro::MCA2 (lines #2 and #5). Photographs are representative plants 7 days after 4-h exposure to −7 °C. (E) The survival ratio at −7 °C was calculated from 9 plants per pots. Data represent the means ± SD calculated from the data of 9 independent experiments. Difference between values of each treatment were evaluated by one-way ANOVA followed by the Tukey-Kramer test. Difference of alphabet letters at each temperature indicates statistically significant difference (p < 0.05). (F) Freezing sensitivity of the mca1 mca2 double mutant without cold acclimation. Three-week-old plants were treated with a freezing temperature. Photographs are representative plants after freezing treatment. Photographs are representative plants 7 days after 1-h exposure to the indicated temperature. (G) The survival ratio was calculated from 9 plants per pots. Difference between values of each treatment were evaluated by one-way ANOVA followed by the Tukey-Kramer test. Difference of alphabet letters at each temperature indicates statistically significant difference (p < 0.05). (H) Electrolyte leakage from non-acclimated wild-type, mca1, mca2, and mca1 mca2 plants after exposure to the indicated temperature. Data represent the means ± SD (n = 3 leaves, each from a different plant). *p < 0.05 compared with the value of wild types at each temperature (ANOVA followed by the Tukey-Kramer test). (I) Photographs are of representative wild type, mca1, mca2, and mca1 mca2 mutants after incubation at 4 °C for 1 month. Five-day-old plants were incubated at 4 °C for 1 month. (J) The chlorophyll content of the plants was determined. Values represent the means ± SD (n = 7 plants per each genotype). Difference of alphabet letters indicates a significant difference (p < 0.05) as determined by one-way ANOVA followed by the Tukey-Kramer test.

