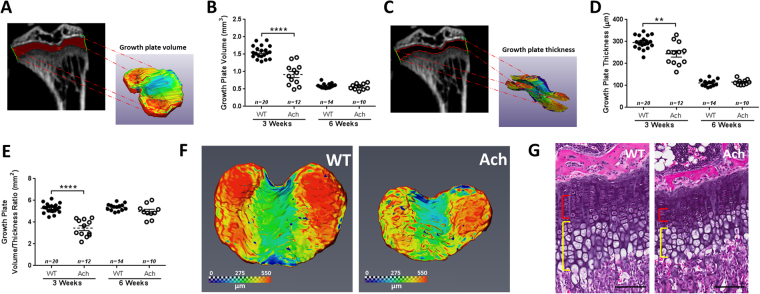
Figure 6.
Micro-CT and histological analysis of the proximal tibia growth plate in WT and Ach mice. 3D reconstructions of the proximal tibia growth plates were generated from micro-CT images to calculate the growth plate volume (A,B) and thickness (C,D) in 3- and 6-week-old mice. The ratio of the growth plate volume to thickness is summarized in (E). (F) Representative growth plates from 3-week WT and Ach groups showing topographical contours of growth plate thickness. (G) H&E of 3-week-old growth plates show narrow proliferative (red bracket) and hypertrophic (yellow bracket) zones in Ach mouse compared to WT mouse. Scale bars: 100μm. The graphical data are represented as mean ± SEM (**0.001 < p < 0.01, ****p < 0.0001).

