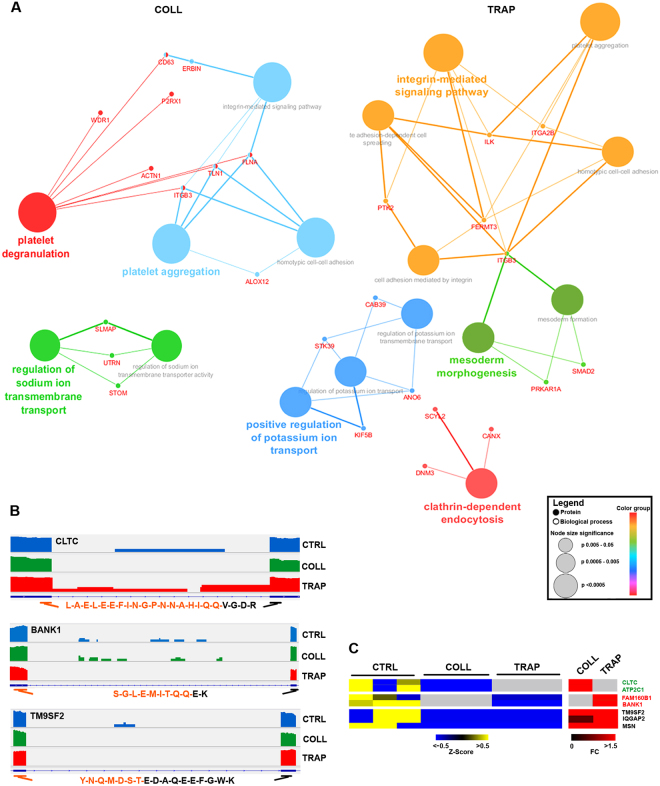
Figure 5.
Correlations between intron removal and protein expression. (A) Functional networks showing pathways affected by upregulated proteins whose corresponding transcripts underwent intron removal upon platelet stimulation with COLL (left networks) or TRAP (right networks). (B) IGV screen-shots showing differentially retained introns in resting and activated platelets in transcript regions and the corresponding peptide sequence mapping on exon/exon junctions identified after activation. (C) Heatmap showing downregulated introns (yellow/blue heatmap) and the corresponding exon/exon junction peptide changes following activation (red heatmap) after activation with COLL and/or TRAP. Gray: not statististically significant.

