
Figure 1.
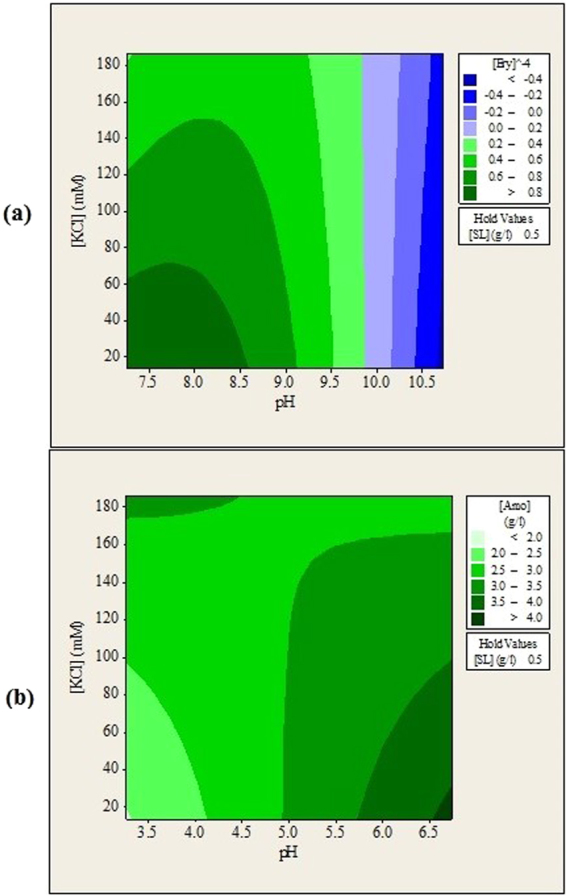
Contour plots of (a) erythromycin and (b) amoxicillin remained in aqueous solution (g/L) after forward extraction versus feed solution pH, KCl concentration.
Official websites use .gov
A
.gov website belongs to an official
government organization in the United States.
Secure .gov websites use HTTPS
A lock (
) or https:// means you've safely
connected to the .gov website. Share sensitive
information only on official, secure websites.
Contour plots of (a) erythromycin and (b) amoxicillin remained in aqueous solution (g/L) after forward extraction versus feed solution pH, KCl concentration.