Figure 2.

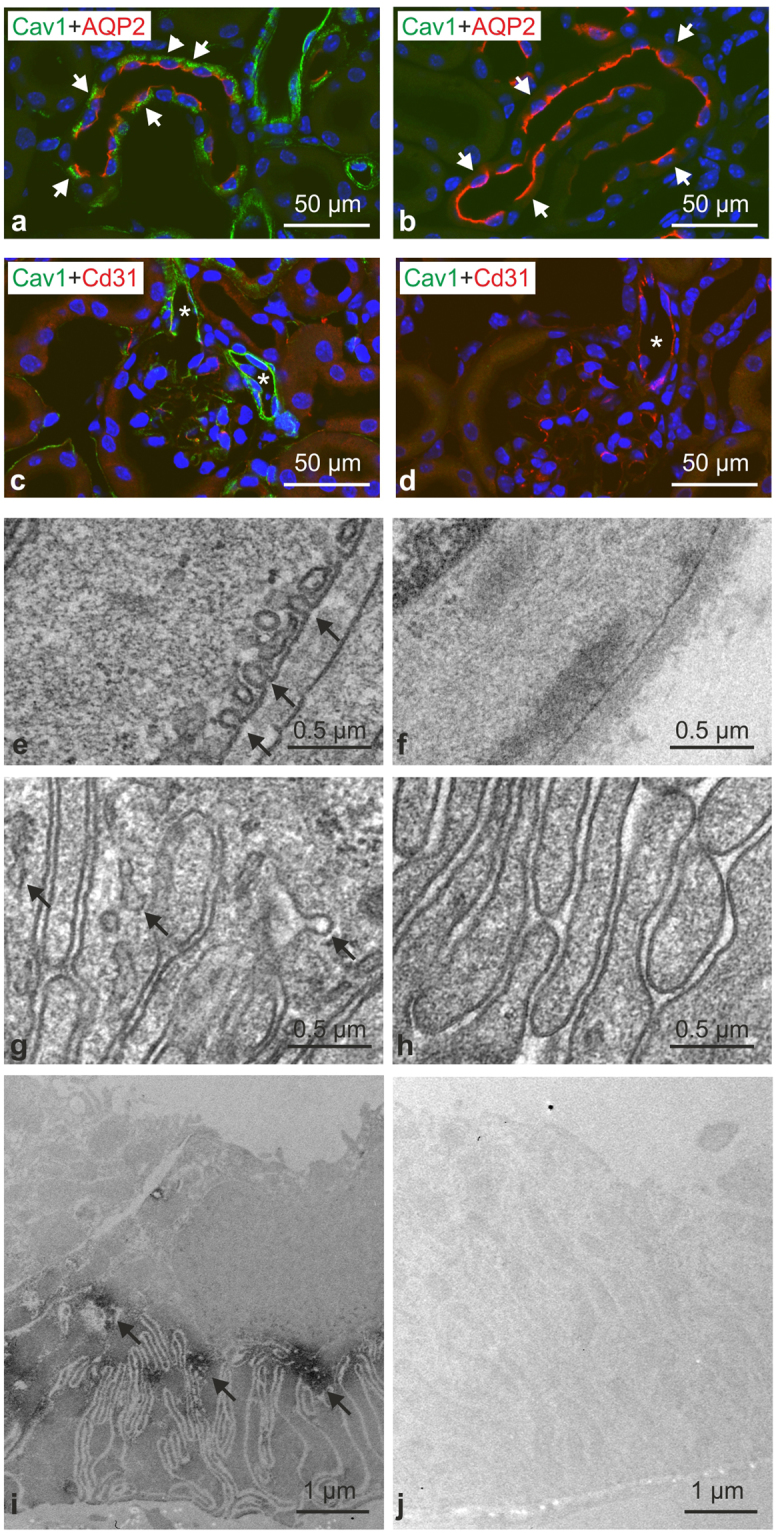
Verification of caveolin-1 deficiency. (a,b) Representative confocal images of control WT (a; n = 4) and Cav1-deficient kidneys (b; n = 4) after double immunofluorescence staining for Cav1 (green signal) and AQP2 (red signal) showing strong basolateral Cav1 labeling in WT CD principal cells identified by positive luminal AQP2 signals (exemplified by arrows); no corresponding Cav1 signal was detected in Cav1−/− kidneys (arrows). (c,d) Double staining for vascular Cav1 signal (green; arterioles marked with asterisks) and endothelial marker CD31 (red) in WT (c) and Cav1−/− kidneys (d); note strong Cav1 signal in WT but not in Cav1−/− vessels. (e–h) Representative transmission electron microscopy images of WT (e,g) and Cav1-deficient kidneys (f,h) documenting caveolae (arrows) in the plasma membrane of WT vascular smooth muscle (e) and CD principal cells (g), and absence of caveolae in Cav1-deficient vascular smooth muscle (f) and CD principal cells (h). (i,j) Pre-embedding labeling of WT and Cav1−/− kidney sections for Cav1 detected by transmission electron microscopy shows basolateral Cav1 labeling of principal CD cells in WT (arrows) but not in Cav1 kidneys.
