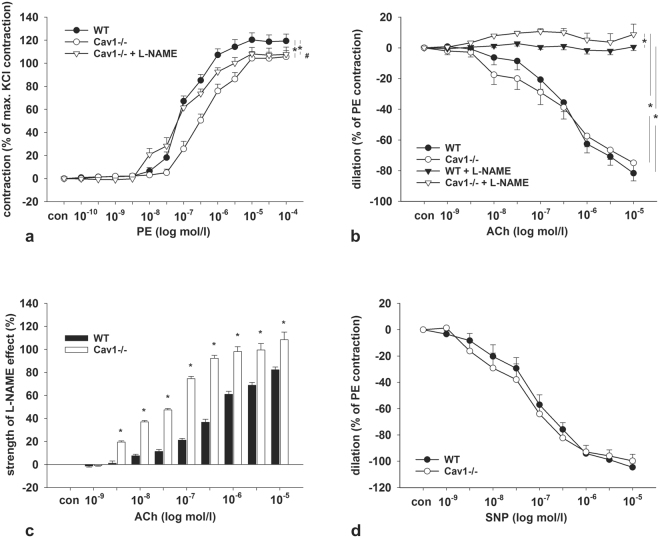
Figure 4.
Effects of caveolin 1-deficiency on arterial contraction and relaxation. (a) Phenylephrine (PE) cumulative concentration response curves (10–10 to 10−4 mol/l) in WT (n = 13) and Cav1-deficient mice (Cav1−/−; n = 12) with and without L-NAME pretreatment (n = 10 and n = 13, respectively). (b) Acetylcholine (ACh, 10−9 to 10−5 mol/l) cumulative concentration response curves in WT (n = 16) and Cav1−/− (n = 14) with and without L-NAME pretreatment (n = 10 and n = 9, respectively). (c) Effects of L-NAME pretreatment on the vascular tone during ACh application (calculated from data in Fig. 4b). (d) Sodium nitroprusside (SNP, 10−9 to10−40 mol/l) cumulative concentration response curves for WT (n = 18) and Cav1−/− (n = 15). Data are expressed as the mean values ± standard deviations, *p < 0.05. *Indicates significant differences between groups (ANOVA like Brunner Test for non-normal distribution), # Indicates significant differences between Cav1−/− and Cav1−/− + L-NAME. (ANOVA, Student’s test for normal distribution and post hoc Mann Whitney test for independent groups).

