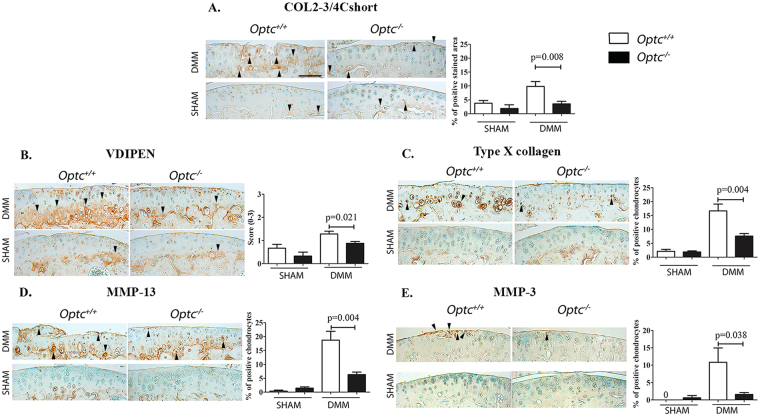
Figure 2.
Immunohistochemistry of articular cartilage 10 weeks after DMM surgery. Representative sections and histograms of the percentage of positive chondrocytes or matrix staining of cartilage degradation markers in medial tibial plateaus (A–E) from Optc +/+ and Optc −/− mice at 10 weeks after sham (control) and DMM surgery, counterstained with methyl green. Black arrowheads indicate stained area (A,B) or positive-stained cells (C,D,E). Bar in (A) = 100 μm. Original magnification X250. Values are the mean ± SEM of sham (control) (n = 6/group), DMM-Optc +/+ (n = 9) and DMM-Optc −/− (n = 8). p values were determined by Mann-Whitney test; only significant p values are shown except for those between sham and their respective DMM groups which are < 0.050. Negative controls are shown in Supplementary Material Fig. S10.

