Figure 5.
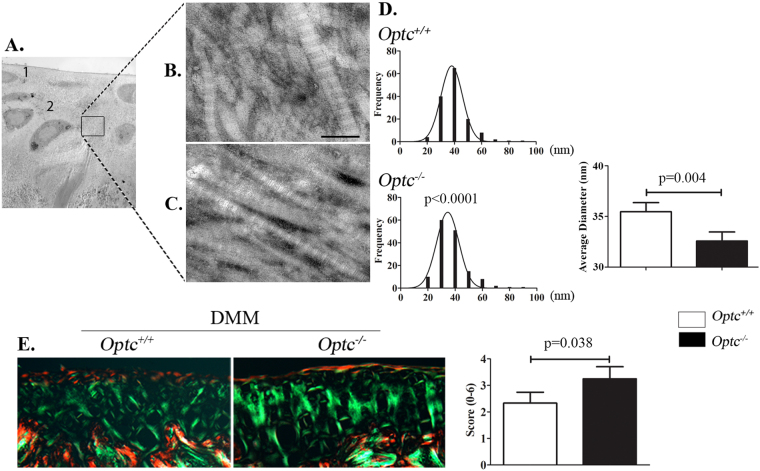
Ultrastructure of type II collagen fibers. Representative images obtained with transmission electron microscopy (TEM) of (A) cartilage, in which 1 indicates the upper zone and 2 the deep zone, and collagen fibers from (B) Optc +/+ and (C) Optc −/− mice at 10 weeks of age. Bar in (B) = 100 μm. Magnifications: (A) X1200 and (B,C) X30000. (D) Histograms represent the frequency of each fiber’s diameter and the average diameter of Optc +/+ and Optc −/− mice. (E) Picrosirius red staining of mouse cartilage from DMM-Optc +/+ and DMM-Optc −/− mice and the histogram representing the birefringence score. Values in graphs in (D,E) are mean ± SEM. p values were determined by Mann-Whitney test.

