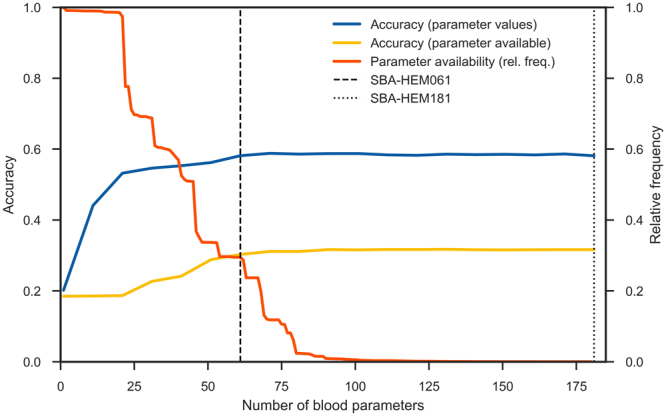
Figure 5.

Influences of parameter frequency, presence and actual measured values on model accuracy. The actual parameter value (blue line) and its presence (whether it was measured or not (in yellow line) are depicted, as well as relative frequency of the parameters (the ratio of how many times they were measured to the total number of measurements in orange line). To obtain the blue accuracy curve, the actual parameter values were used for training and testing, while for the yellow accuracy curve, the parameter values were replaced with either 0 (not measured) and 1 (measured), and no imputation was used. The flattening of both accuracy curves indicates that, when the frequently measured parameters are present, the rarely measured parameters contribute little to model accuracy.
