Fig. 1.
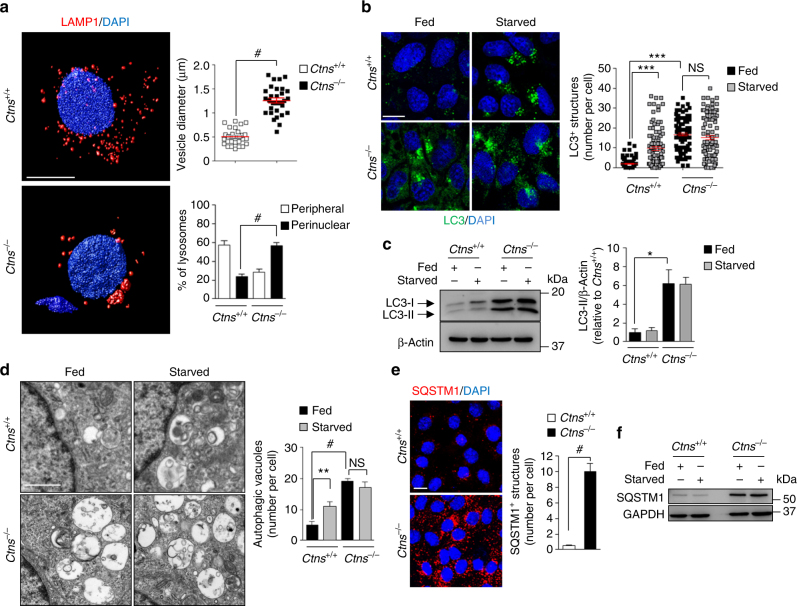
Abnormal lysosome dynamics and autophagy in CTNS-deficient PT cells. a Left: confocal microscopy and three-dimensional (3D) reconstruction of Ctns mPTCs labeled with anti-LAMP1 (red) antibody. Right: quantification of changes in vesicle size (top, each point representing the average size of LAMP1+ vesicles in a cell) and lysosome positioning (bottom, percent of perinuclear or peripheral distribution) (n = 30 cells pooled from 3 Ctns kidneys per group; two-tailed unpaired t-test, #P < 0.0001 relative to Ctns+/+ mPTCs). b–f Ctns mPTCs were cultured in normal growth (Fed; 8 h) or nutrient-deprived cell medium (Starved; 8 h). b Representative confocal micrographs (left) and quantification (right) of numbers of LC3+ structures (green) in Ctns mPTCs (n = 100 cells pooled from three Ctns kidneys per group; each point representing the number of LC3+ vesicles in a cell; one-way analysis of variance (ANOVA) followed by Bonferroni’s posthoc test, ***P < 0.001 relative to Ctns+/+ mPTCs under fed conditions; NS, not significant.). c Western blotting and densitometric analyses of LC3 protein levels. β-Actin was used as a loading control. Two-tailed unpaired Student’s t-test, *P < 0.05 relative to Ctns+/+ mPTCs under fed conditions, n = 3 independent experiments. d Representative electron micrographs (left) and quantification (right) of numbers of autophagic vacuoles per cell (n = 10 micrographs per each condition; one-way ANOVA followed by Bonferroni’s posthoc test, **P < 0.01 and #P < 0.0001 relative to Ctns+/+ mPTCs under fed conditions; NS, not significant). e Representative confocal micrographs and quantification of SQSTM1+ structures (red) in Ctns mPTCs (n = 100 cells pooled from three Ctns kidneys per group; two-tailed unpaired Student’s t-test, #P < 0.0001 relative to Ctns+/+ mPTCs). f Representative western blotting of SQSTM1 in Ctns mPTCs. GAPDH was used as a loading control, n = 3 independent experiments. Plotted data represent mean ± SEM. Nuclei are counterstained with DAPI (blue). Scale bars are 10 μm in a, b, and e, and 2 μm in d. Unprocessed scans of original blots are shown in Supplementary Fig. 13

